
Run an Analysis
Automated notifications can help you proactively manage active events, but you may still need to manually run an analysis, past scenario or a custom footprint. The Event Response application gives you access to all available hazard data across all perils in one place. The analysis helps you understand how an active or historical event may impact your insured portfolio by combining hazard footprints, severity data, and your financial metrics.
Steps to run an analysis are detailed below:
- Select an Event
- Select Perils
- Identify Portfolio
- Set Up Financial Calculations & Edit Damage Factors
- Run Analysis
- FAQs
Select an Event
To get started, first filter, sort, and search to find an event from our extensive catalog.
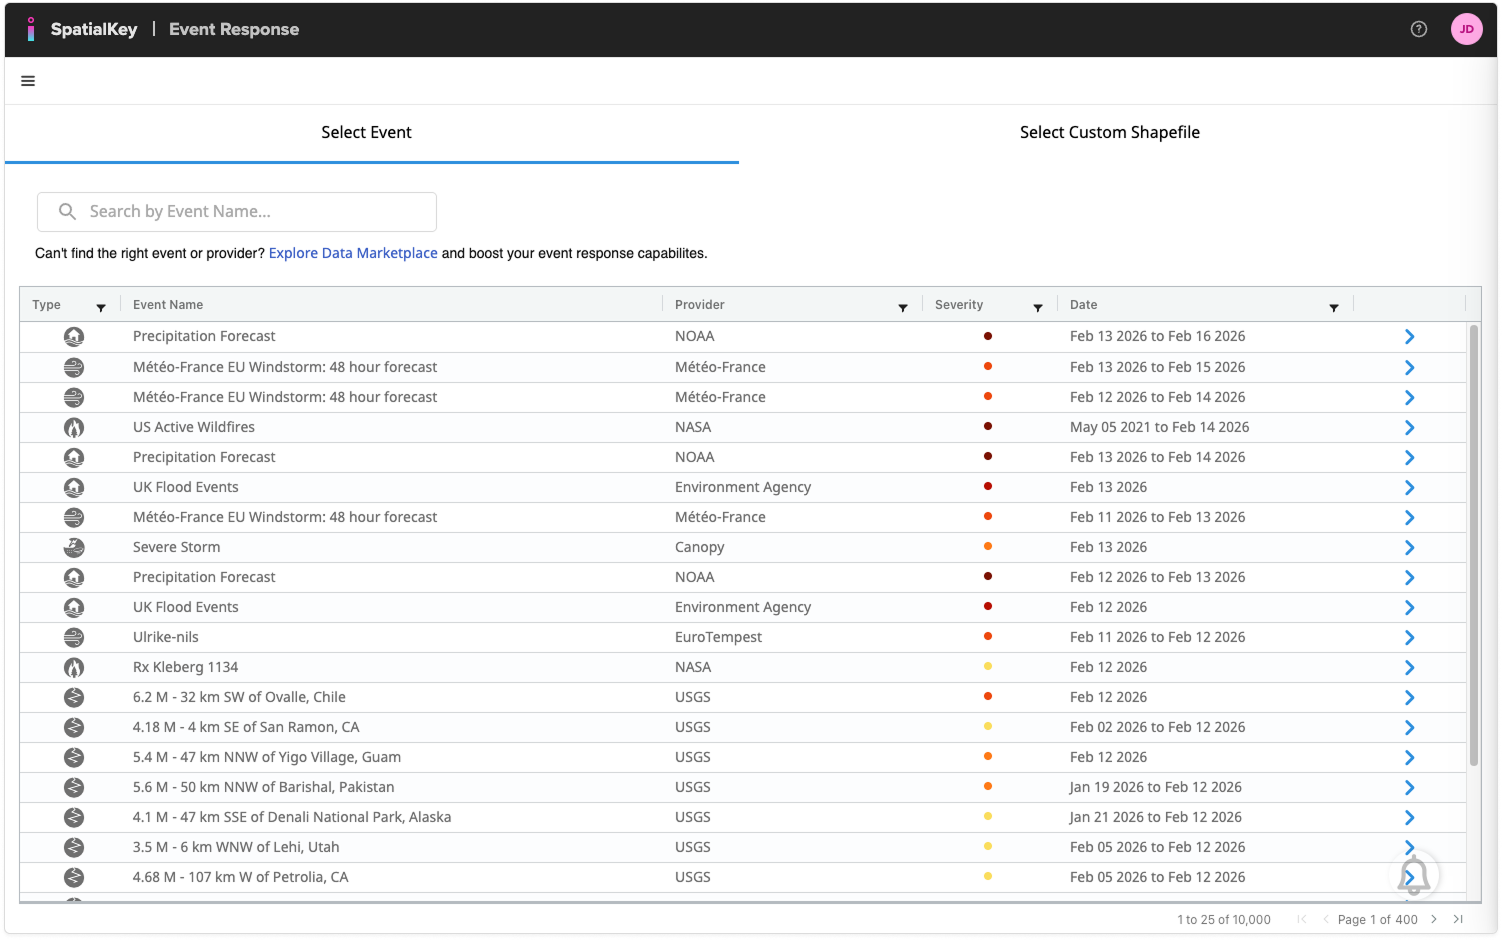
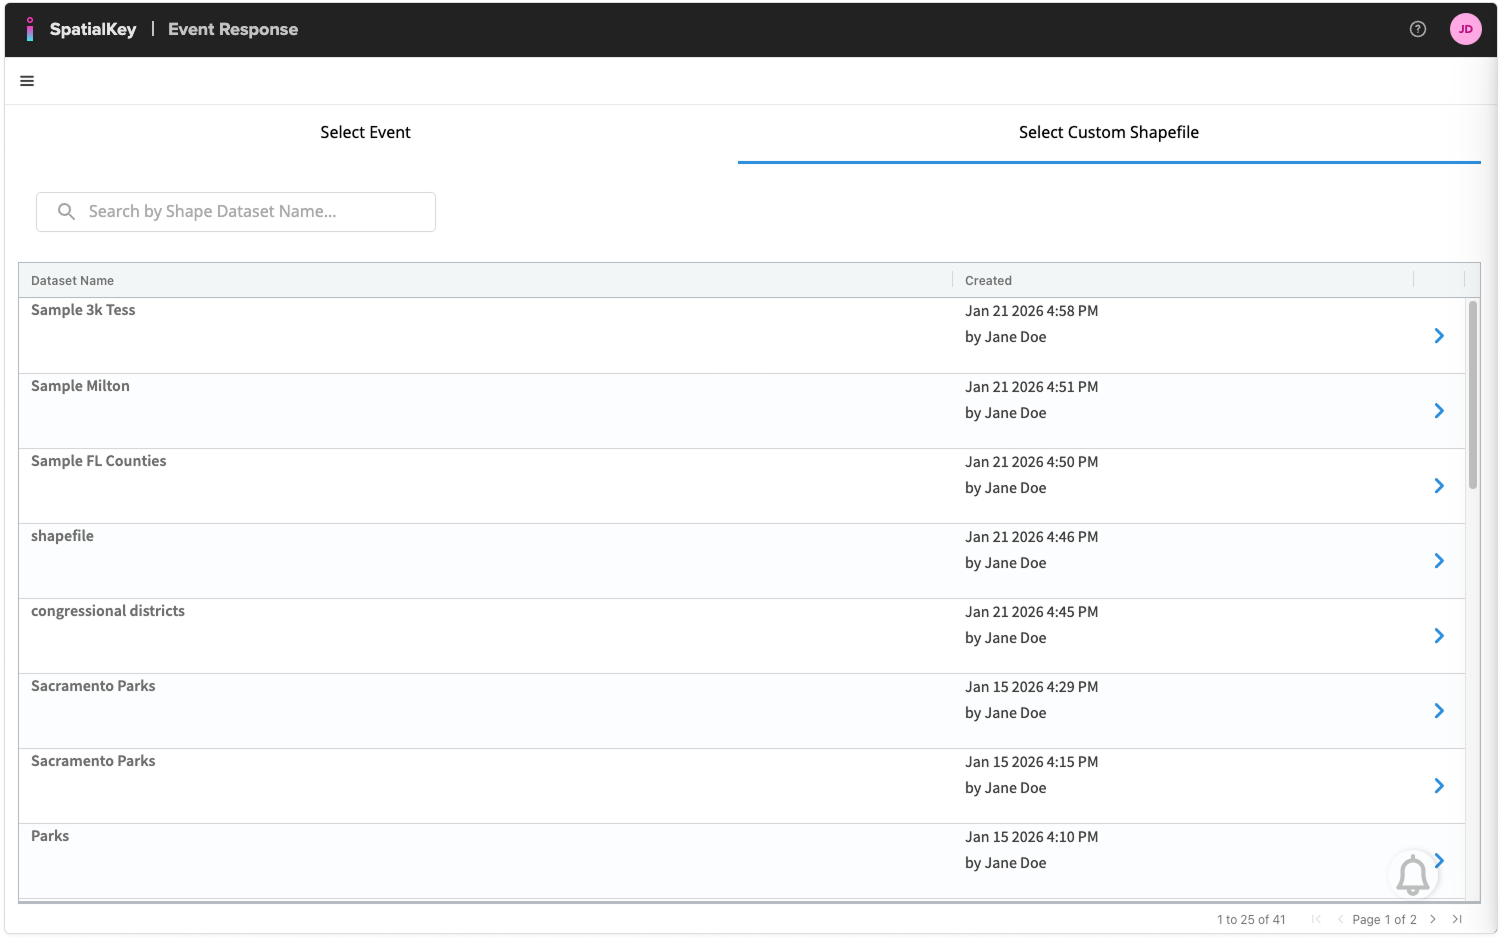
Or click the Select Custom Shapefile tab at the top to choose your own custom shapefile to use as a footprint.
Select Perils
After selecting an event, you can view and choose from all available providers (both public and commercial) and perils (e.g., hurricane or storm surge) relevant to your analysis.
- Use the checkboxes to select which hazards and perils to include.
- Click a hazard title to preview the footprint.
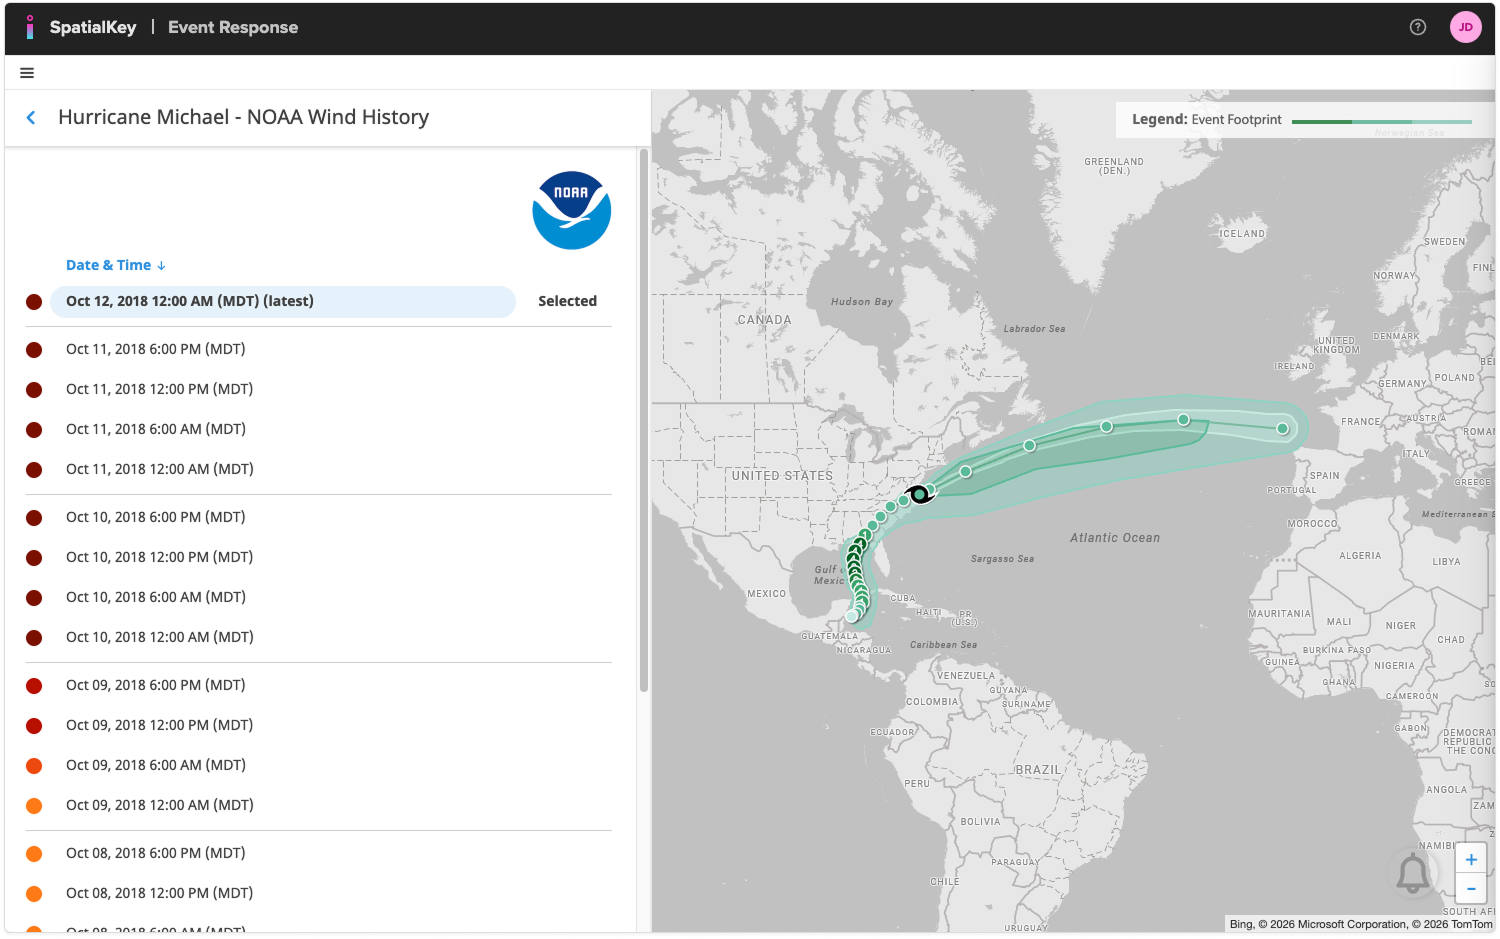
- Click the clock rewind icon to select from past vintages to review the point of landfall, or see how the storm has changed from prior forecasts.
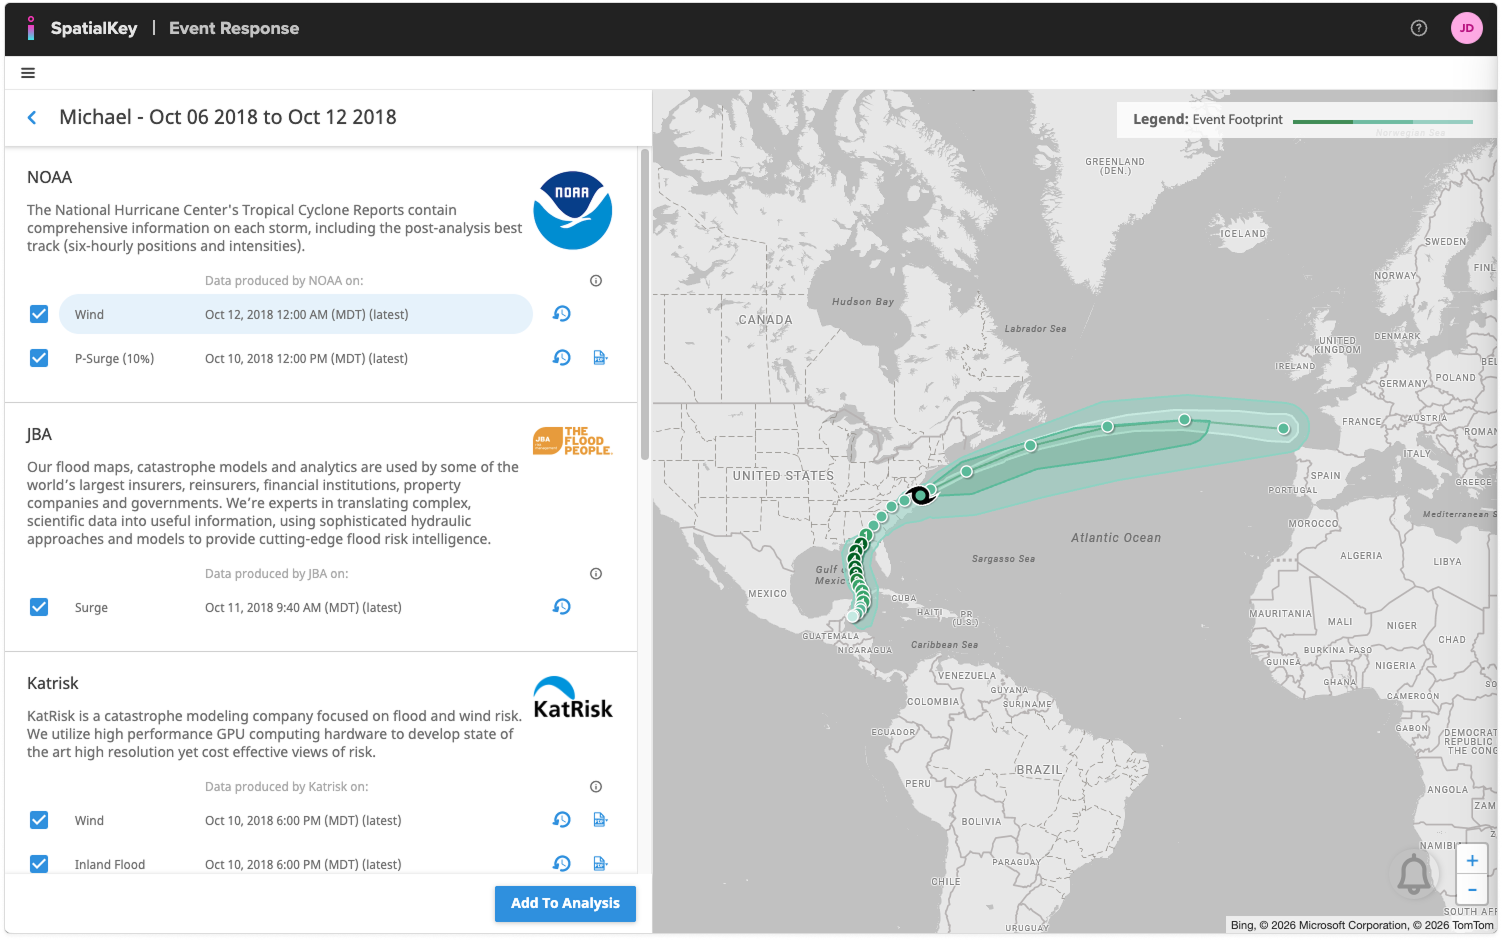
TIP! Download a PDF for each provider and hazard for more info, including when you can expect updates and what your dataset will look like after running the enhancement. View all providers here.
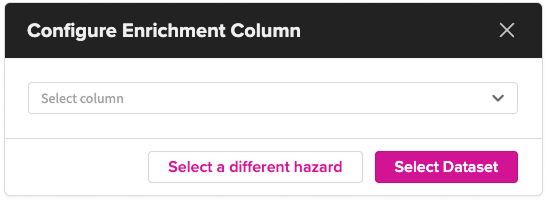
If you ran a custom footprint, you’ll skip the peril‑selection step and instead choose an enrichment column. This column serves as a substitute for the severity data that would normally accompany an event from a standard vendor.
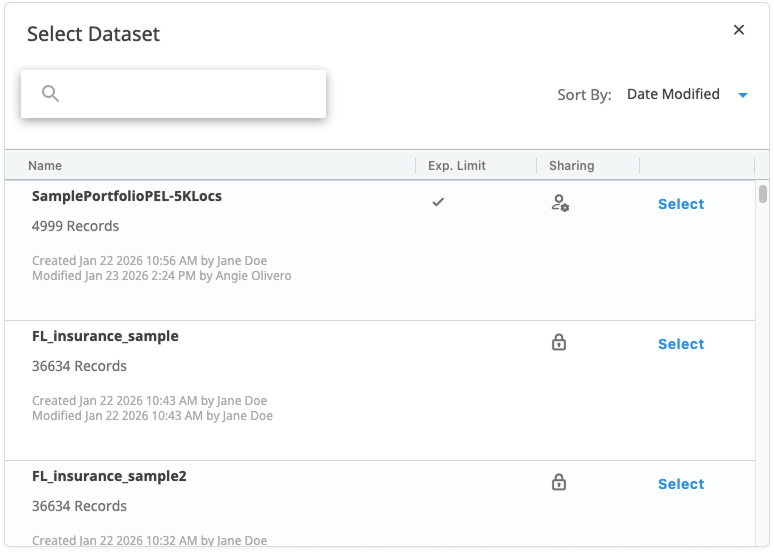
Identify Portfolio
Next, use the modal shown here to choose the portfolio dataset you want to include in the analysis. If the dataset contains policy information (highly recommended), you’ll provide additional details about it in the next step. Learn how to join a policy file to your location file.
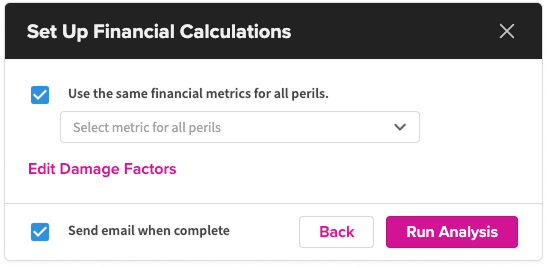
Set Up Financial Calculations & Edit Damage Factors
Next, a modal will appear where you can select your financial metric(s) and adjust damage factors.
If you chose a portfolio that includes a joined policy file in the previous step, you can use that information here to help the analysis more accurately calculate your exposure to the event. The financial metric dropdown will display any perils from your policy data. You can apply the same metric (peril) to all hazards, or uncheck the box to choose different metrics for each one (e.g., if your flood and wind coverages use different metrics).
If you don’t have policy information, you can use Total Insured Value (TIV) as a proxy, though results will be less precise since policy terms aren’t available.
Learn more about SpatialKey’s financial model.
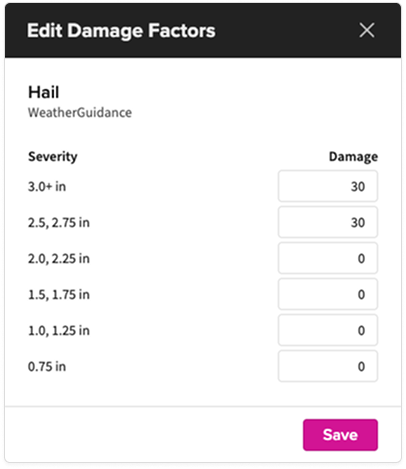
Edit Default Damage Factors
You can also adjust damage factors for an individual analysis during the Set Up Financial Calculations step. If no changes are made, the analysis will use the organization-level defaults (see Default Damage Factors).
You can define damage percentages for each peril selected in earlier steps. Click the pencil icon to edit a peril, then specify damage values for each severity level.
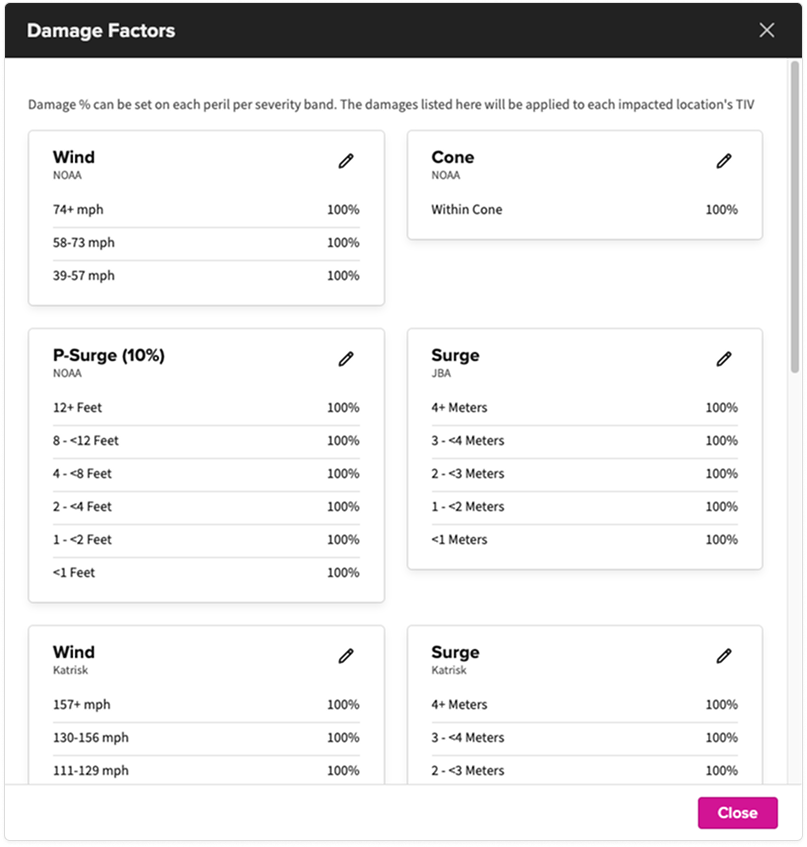
For example, hail events with severity 3.0+ inches may be assigned a higher damage percentage than 0.25 inches, improving the accuracy of exposed-limit calculations.
Any custom damage factors you apply will appear in the dashboard as calculated columns on the Locations tab. When custom damages are used, this will be clearly indicated in the labeling (for example, “Damaged TIV”).
Run Analysis
Finally, click Run Analysis. SpatialKey will process your portfolio, assess potential event impact, and calculate your financial exposure. You can wait on this screen for the analysis to finish, or click Return to Apps to continue working while it runs in the background.
If you selected Send Email When Complete in the previous step, you’ll receive an email once the analysis finishes. Regardless of that setting, you’ll also get a notification in the application’s header notifications panel.

Next let’s visualize and understand your Event Response results.
FAQs
What is a “provider” and why are there multiple for some events?
Providers are data sources (public or commercial). Multiple providers may offer different hazard models or footprints for the same event so you can compare methodologies. See All Event Response Data Available.
What are “past vintages” and why would I use them?
Past vintages are older forecast snapshots. You might use them to review how a storm’s track or intensity changed over time or to validate model vs. actual outcomes.
Can I include multiple hazards in one analysis?
You can run only one event at a time, but within that event (e.g., a hurricane) you can choose multiple hazards and peril types—such as wind, surge, or flood—from any combination of providers.
What happens if my portfolio dataset doesn’t include policy‑level information?
You can select Total Insured Value (TIV) as a proxy. Results remain useful but less precise because deductible, limit, and coverage terms cannot be applied.
Learn how to join a policy file to your location file and Learn more about SpatialKey’s financial model.
What are damage factors and why change them?
Damage factors represent expected loss percentages at each severity level. Editing them allows you to reflect internal assumptions, vendor guidance, or peril‑specific nuances (e.g., hail damage). Learn how damage factors work in Event Response.
Do damage factor edits apply globally or only to the current analysis?
Edits you make during the setup of a manual analysis apply only to that single analysis—they do not change your organization’s defaults.
However, if you are an administrator and you update global default damage factors, those changes will apply to all future analyses run across the organization (unless a user manually overrides them for a specific analysis).
How long does an analysis take to run?
It varies based on dataset size and number of hazards. You can stay on the page or move on to other tasks. You’ll get a notification—and optionally an email—when it’s done.
Was this helpful?