
Damage Factors are one of the most important components of an Event Response analysis. They translate hazard severity—such as wind speed, hail size, flood depth, or other peril‑specific metrics—into an estimated percentage of damage for each location in your portfolio. When applied to financial metrics, these percentages determine how much of a location’s value is considered “damaged” or exposed during an event.
Understanding and properly configuring Damage Factors ensures that your analysis outputs are realistic, defensible, and aligned with your organization’s risk assumptions. This article explains how Damage Factors work, when to adjust them, and how they influence your results.
- What Are Damage Factors?
- Where Damage Factors Are Used
- How Damage Factors Influence Exposure Calculations
- Editing Damage Factors for a Single Analysis
- Default vs. Custom Damage Factors
- Why Damage Factors Matter
- Best Practices for Setting Damage Factors
What Are Damage Factors?
Damage Factors are predefined percentages that estimate the proportion of a location’s insured value expected to be damaged at a given level of hazard severity. Each peril—hail, hurricane wind, storm surge, flood, wildfire, etc.—has its own severity scale. For each severity tier, you assign a damage percentage.
For example:
| Hail Size (inches) | Damage Factor (%) |
|---|---|
| 3.0″+ | 40% |
| 1.0″ | 10% |
| 0.25″ | 1% |
These percentages determine how much exposure is counted as “damaged TIV” in the analysis.
Where Damage Factors Are Used
Damage Factors come into play in the Set Up Financial Calculations step of running an Event Response analysis. At this stage, users:
- Select financial metrics (e.g., policy terms or TIV)
- Review or modify the Damage Factors for each selected peril
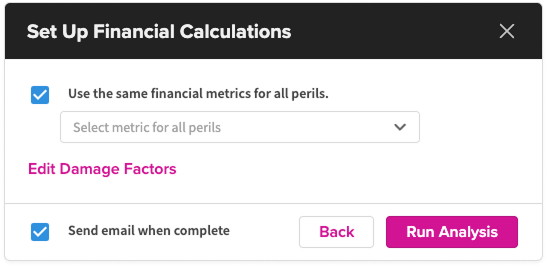
Unless you make changes, analyses use your organization‑level default Damage Factors, which are managed by Super Admins or Data Admins.
How Damage Factors Influence Exposure Calculations
When the system evaluates each location against a hazard footprint:
- The hazard severity at that exact location is identified (e.g., storm surge depth of 2.5 ft, hail size of 1.75″, wind speed of 110 mph).
- The corresponding Damage Factor percentage is applied.
- That percentage is multiplied by the location’s TIV.
Example:
A location with $5M TIV experiences hail of 2.0″, and the Damage Factor for that severity is 25%.
→ Damaged TIV = $5,000,000 × 0.25 = $1,250,000
This value is then processed through the financial model, which applies your policy terms. The resulting damaged exposure is aggregated across all impacted locations and displayed in your dashboards, reports, and total exposure summaries.
Editing Damage Factors for a Single Analysis
During the Set Up Financial Calculations step, each peril has a pencil‑edit icon. Clicking it allows you to:
- Adjust severity thresholds
- Change damage percentages
- Apply more or less conservative assumptions for that specific event
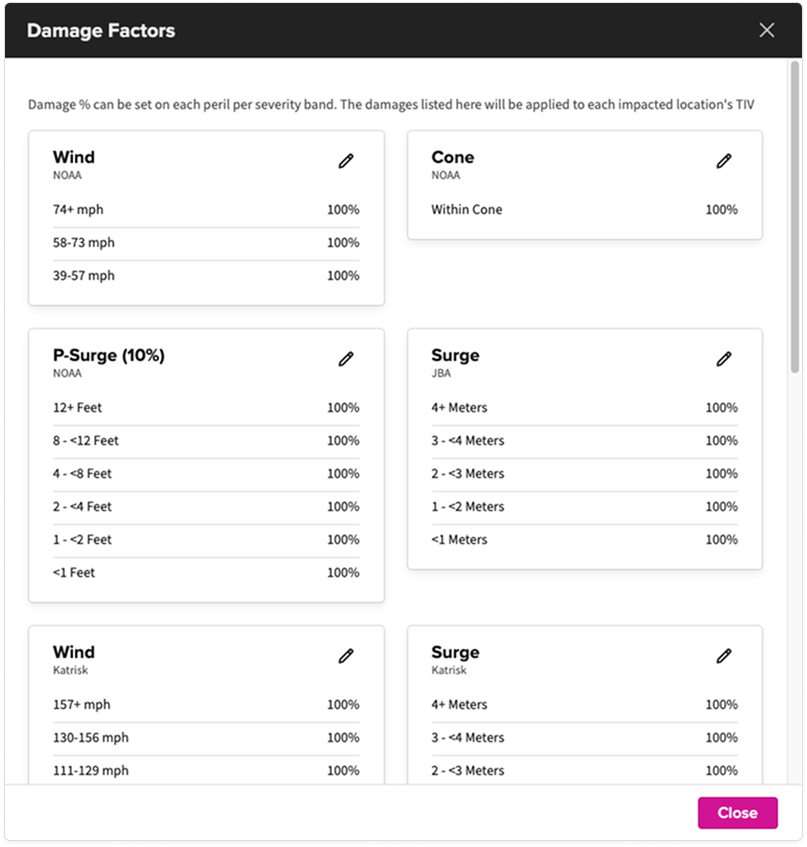
These edits do not change the organization’s default settings—they apply only to the current analysis.
When custom Damage Factors are used:
- They are clearly labeled in the dashboard (e.g., “Damaged TIV (Custom Factors)”)
- Calculated columns appear on the Locations tab for transparency
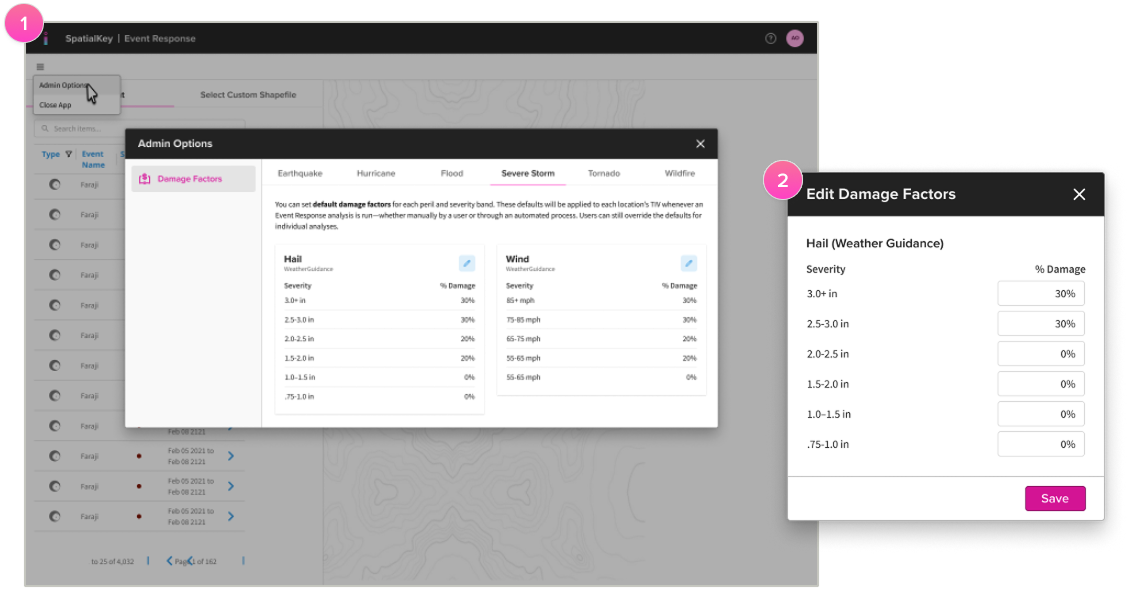
Default vs. Custom Damage Factors
- Users with Super Admin or Data Admin permissions can manage their organization’s default damage assumptions from the Event Response setup screens by opening the hamburger menu in the Event Response setup screens.
- By default, impacted locations are assumed to be damaged at 100% when estimating exposure. This is intentionally conservative and meant to be replaced with more realistic peril‑based values. Admins can customize these default damage factors, and those values will be applied automatically to all subsequent analyses.
Admins typically tailor defaults based on:
- Historical claims data
- Engineering assumptions
- Risk model outputs
- Organizational risk appetite
Custom Damage Factors (Per‑Analysis)
Any analyst—not just Admins—can adjust factors per analysis to:
- Test alternative scenarios
- Align with event‑specific intelligence (e.g., “this hail storm caused widespread roof failures”)
These changes do not affect defaults.
Why Damage Factors Matter
Accurate Damage Factors directly improve:
- Exposure Accuracy
They refine how much of your portfolio is realistically at risk. - Comparability Across Events
Standardized damage assumptions ensure analyses can be compared over time. - Decision Support
Too-high factors may inflate losses; too-low may understate exposure. Tuned values support better response planning. - Transparency and Consistency
Having published defaults helps teams understand the assumptions behind every analysis.
Best Practices for Setting Damage Factors
- Align with engineering or actuarial guidance
Use real-world severity-to-damage relationships whenever possible. - Differentiate by peril
Hail behaves differently from wind or flood; don’t use a one‑size‑fits‑all percentage. - Use your organization’s claims history
Historical losses often reveal the most realistic ranges. - Review after major events
Big catastrophes frequently shift industry expectations. - Be transparent internally
Ensure teams understand which factors were used, especially in response workflows.
Was this helpful?