
| Note: This feature is available in SpatialKey Client for Windows applications, i.e., Map Analyst, Hazard Analyst and Accumulations. |
This article will walk you through everything you need to know about thematic mapping in SpatialKey.
- What is a thematic map?
- What thematic options do I have in SpatialKey?
- I’ve set up thematic boundaries, now what?
There are a lot of thematic options, but once you set your data up a couple of times, you will have the hang of it and be able to get your data ready for thematic mapping without even knowing you are doing it!
What is a thematic map?
Thematic maps (aka. Choropleth maps) show a color-coded distribution of a metric for a given unit of geography, like states/provinces, postal codes, or custom business territories. They quickly help visualize key geographic contributors and highlight outliers and trends for datasets. Thematic mapping is just one way of visualizing your data on a map. In SpatialKey, we offer the following geographic visualization options – heat maps, graduated circles, individual points, bivariate grid, and thematic maps.
Sample thematic map showing number of records by County

Thematic maps can also help you visualize data that isn’t otherwise mappable. You may run into a situation where you don’t have address information or latitude/longitude coordinates for individual locations. When this happens, your data cannot be visualized on a map in traditional ways, like individual points or a heat map; but you can still use thematic mapping. Simply assign a thematic boundary identifier to each record in your dataset, and we can create a visual representation of your data.
What thematic options do I have in SpatialKey?
Options during import (in Data Upload Wizard)
SpatialKey offers some out-of-the-box thematic boundaries when importing data:
- US States, Counties, Postal Codes
- Country (boundary is available when you have multiple countries in a dataset)
SpatialKey supports additional boundaries that require an additional subscription level to access:
- High Resolution Postal Codes
- Low Resolution Postal Codes
- CRESTA Zones 2007
- CRESTA Zones 2010
- CRESTA Low Resolution 2013
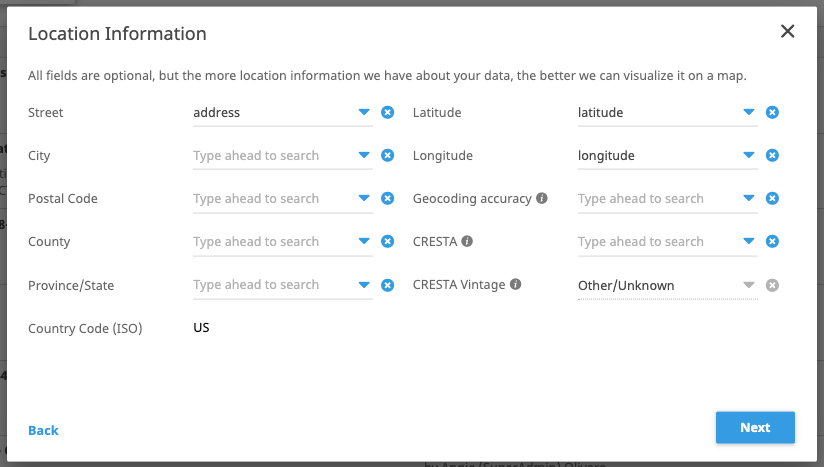
Note that each geographic boundary will require different information when you enable it. The three US options are enabled using point-in-poly spatial queries. This means that based on a location’s latitude/longitude, whether provided or derived from geocoding, SpatialKey determines which boundary (shape) the location falls within. Alternatively, the Country boundary requires identification of a country column containing FIPS or ISO country codes.
Options post-import
You must configure the appropriate thematic boundaries during import because that is the only time in which they can be configured for a dataset. After a dataset is imported, you will only have the option to enable custom thematic boundaries. This works by setting up joins from your point dataset to a shapefile. Details on how to set up the join are provided in this article. This is useful if you want to analyze metric aggregations by business or sales territories, neighborhoods, or something completely unique to your organization.
Supported Countries
This list describes boundaries that SpatialKey has integrated with today. Depending on client needs, boundary data for additional countries can be added. It’s important to note that the countries available for your organization will depend on your organization’s subscription level.
| Country | High Resolution Postal Codes |
Low Resolution Postal Codes |
Other Administrative Boundaries |
|---|---|---|---|
| Australia | 4-digit | ||
| Canada | 3-digit | ||
| France | 5-digit | ||
| Germany | 5-digit | ||
| Japan | 3-digit | ||
| Puerto Rico | 5-digit | 3-digit | |
| United Kingdom | Postcode Sector | ||
| United States | 5-digit | 3-digit | State, County, Postal Code |
Important!
Here are some important items to be aware of:
- The US Postal Code boundary data is different between the US Postal Codes and high/low resolution postal code layers. The US Postal Codes layer uses data from 2019, whereas the high/low resolution postal code layers use data from 2010.
- If more postal code digits are provided in your data than supported, we derive the requisite postal code where possible (e.g. if 9-digit US postal codes are provided, we only use the first 5 digits for boundary matching.
- Padding support for leading zeros that may have been cut off is included.
- Postal codes for the United Kingdom are expected to have a space in them. (e.g. “xxx x” or “xxxx x”). Since we support UK postcode sectors, extra characters are ignored for boundary matching. (e.g. if a postcode of “YO31 1EB” is provided, we only use “YO31 1” for boundary matching)
- CRESTA Zones are not supported for the US.
- CRESTA Zones require both country and CRESTA columns within your dataset. This CRESTA ID should not include the country code (e.g. a full CRESTA ID of FRA.18 should simply be captured with Country = FR and CRESTA ID = 18). If your organization licenses this data with SpatialKey, valid CRESTA codes can be downloaded from the Thematic Configuration screen in the Data Upload Wizard.
I’ve set up thematic boundaries, now what?
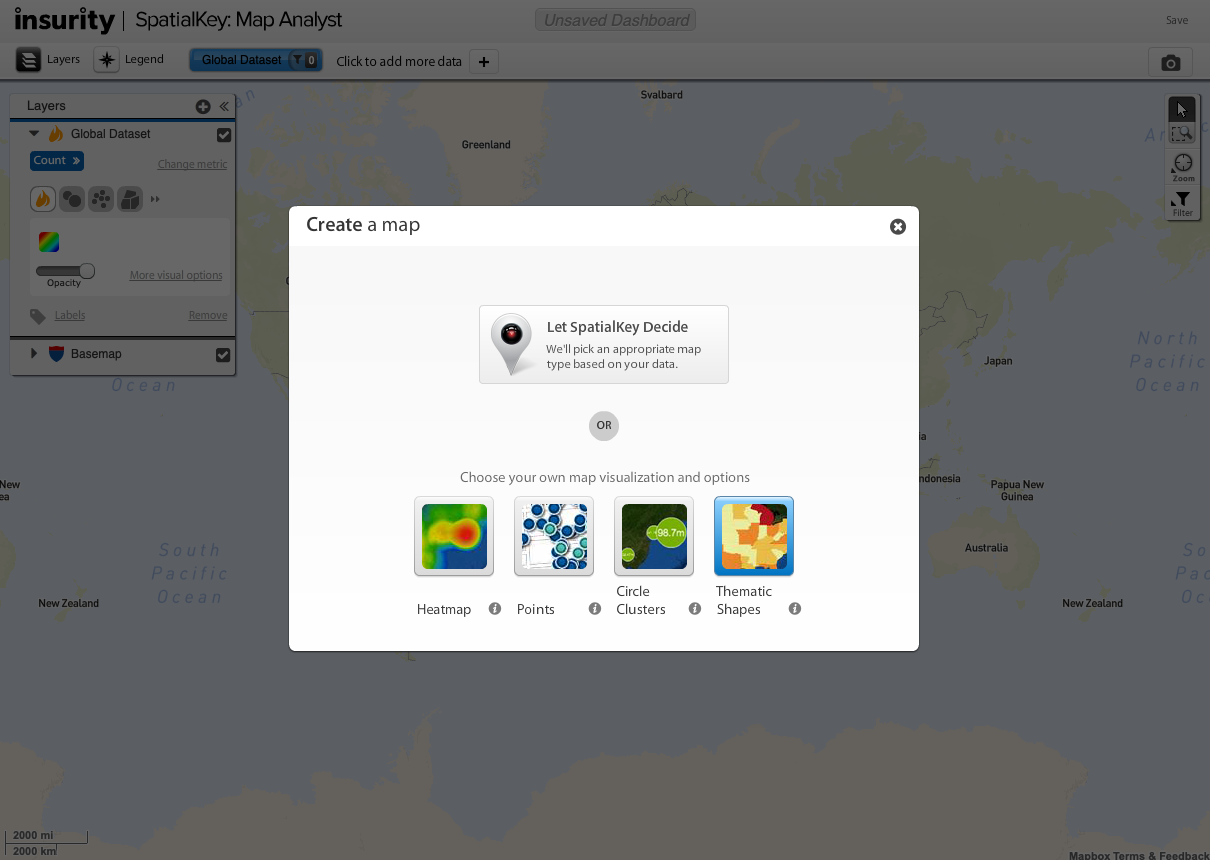
Now for the fun part, let’s visualize your data on a map! Simply, open your dataset in Map Analyst and choose to render your data thematically. When you launch a dashboard, you will be asked to choose your preferred visualization. In this case, we will select the Thematic Shapes option.
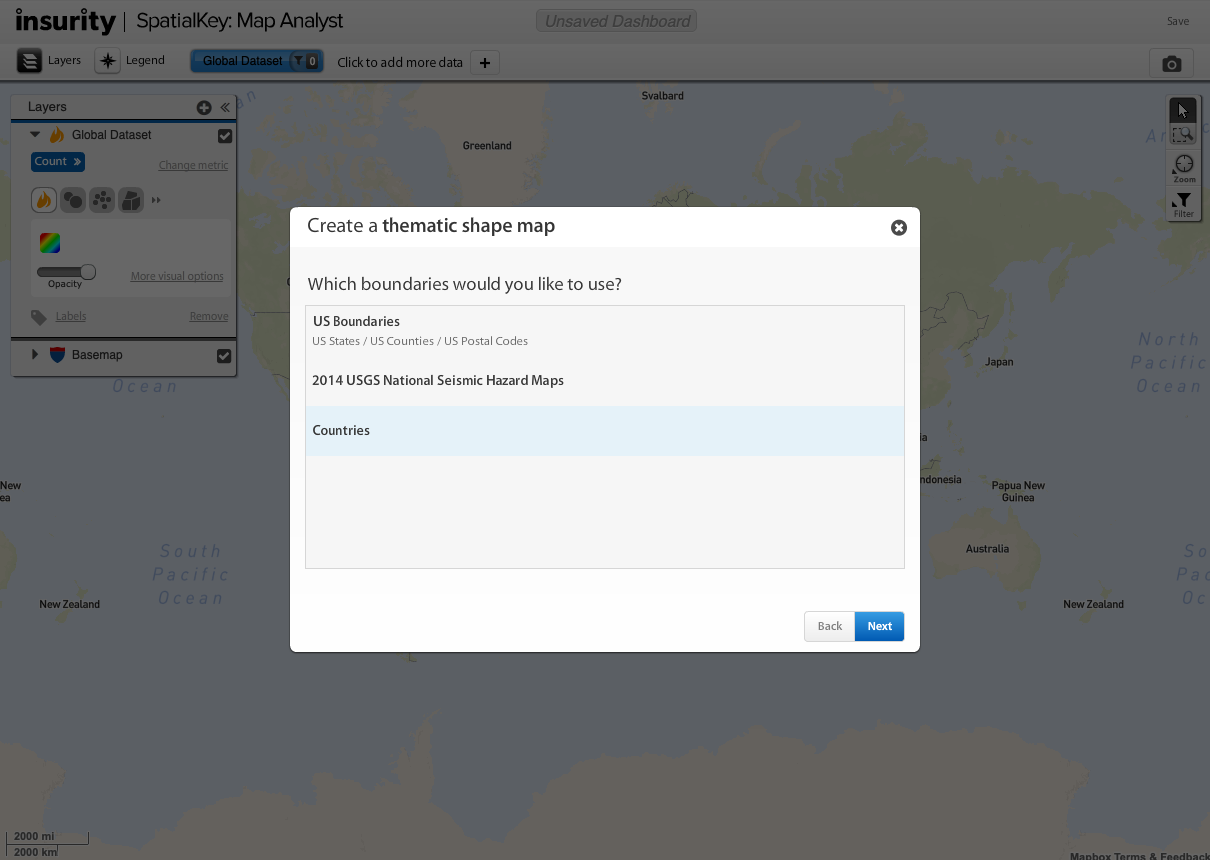
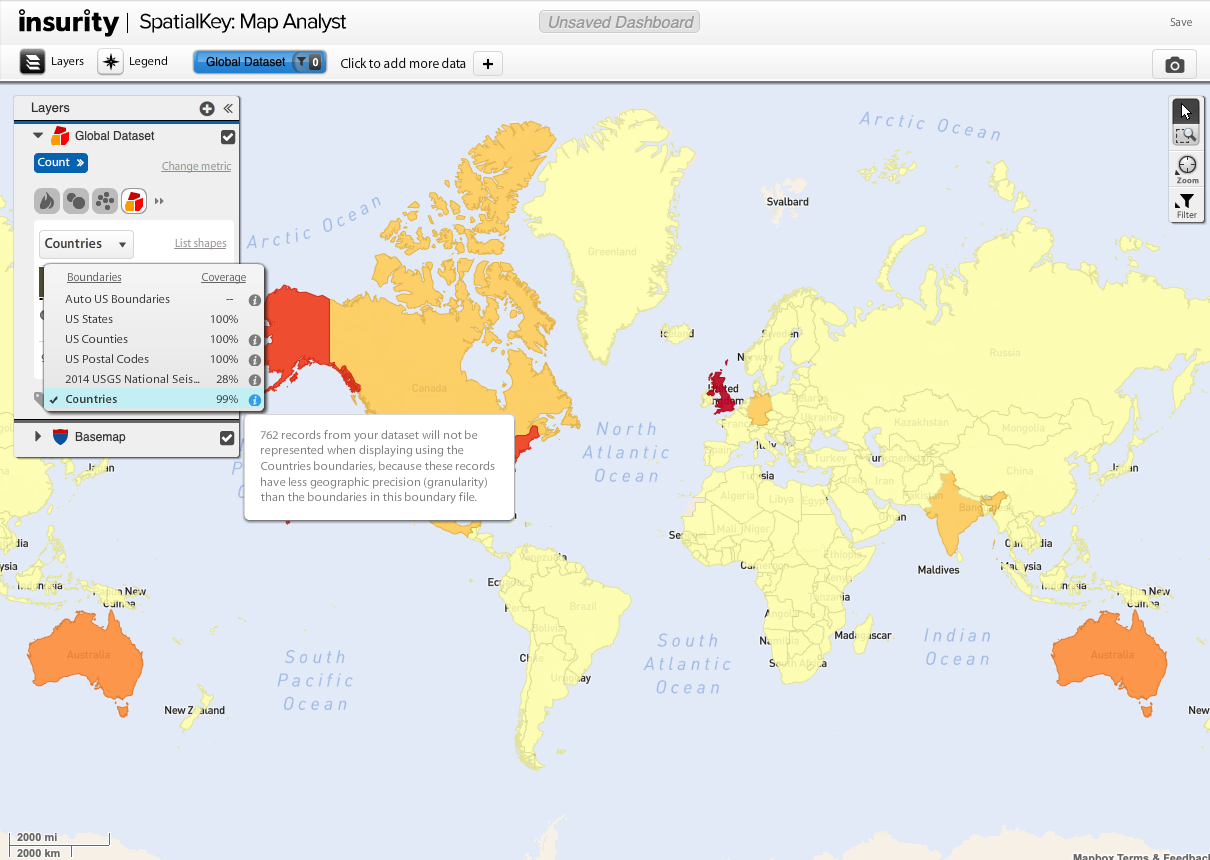
You can view your data thematically by any of the geographic boundaries you enabled during import, or by any custom thematic boundary you set up post-import.
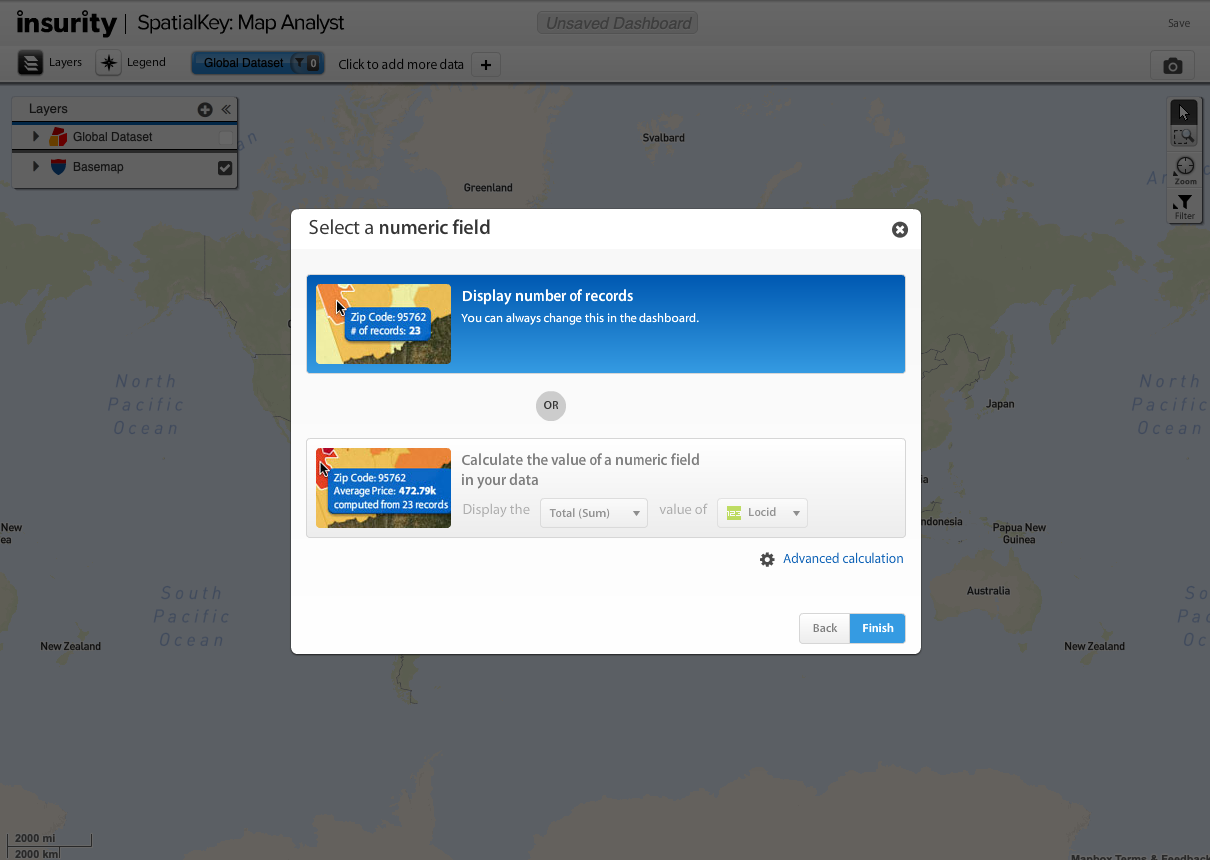
Finally, select a metric to use for the thematic shading.
In this example, we are viewing a thematic map representing the number of records in each country.
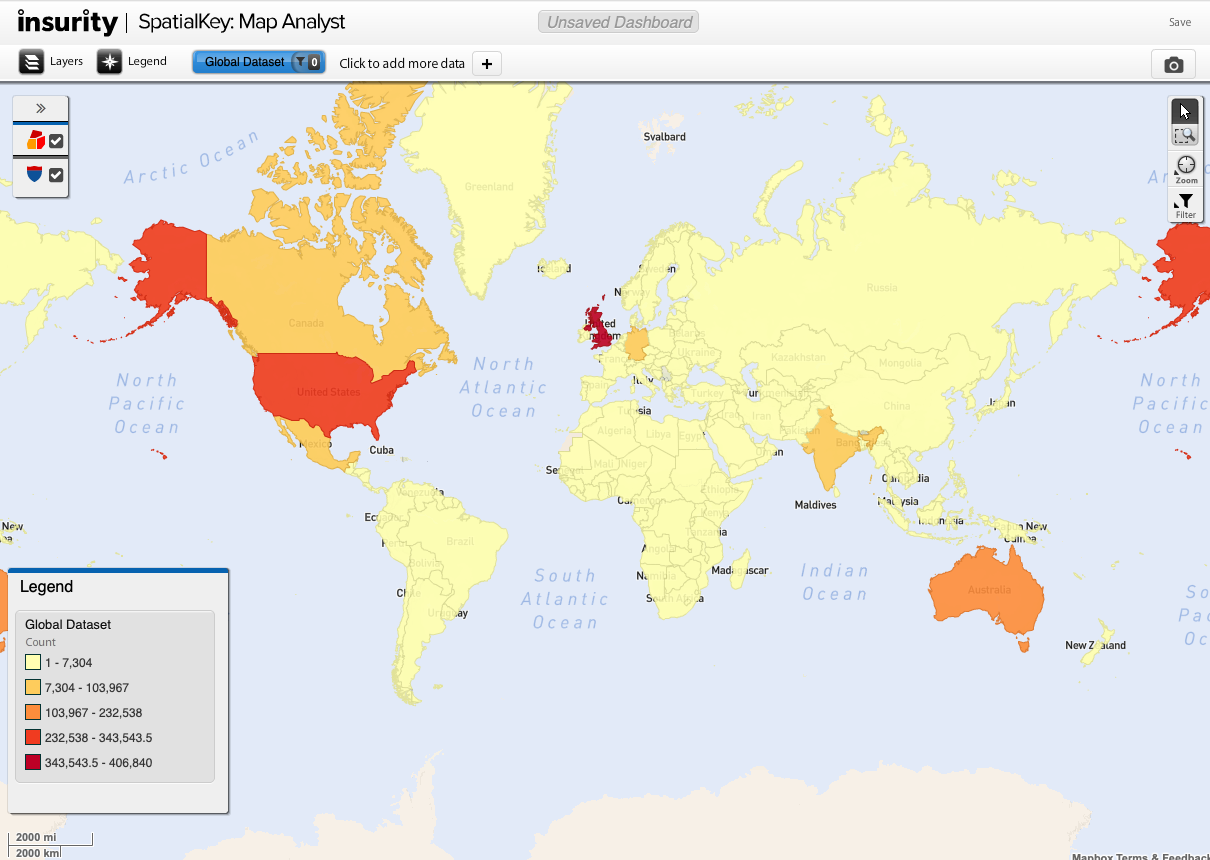
The Layer Manager indicates how much of your dataset was successfully associated with the geographic boundary data and also change the boundary data you wish to display on the map. In this example, there is 99% thematic coverage for the Country boundary, which means that some records (762) have less geographic precision (granularity) than the boundaries in the boundary file.
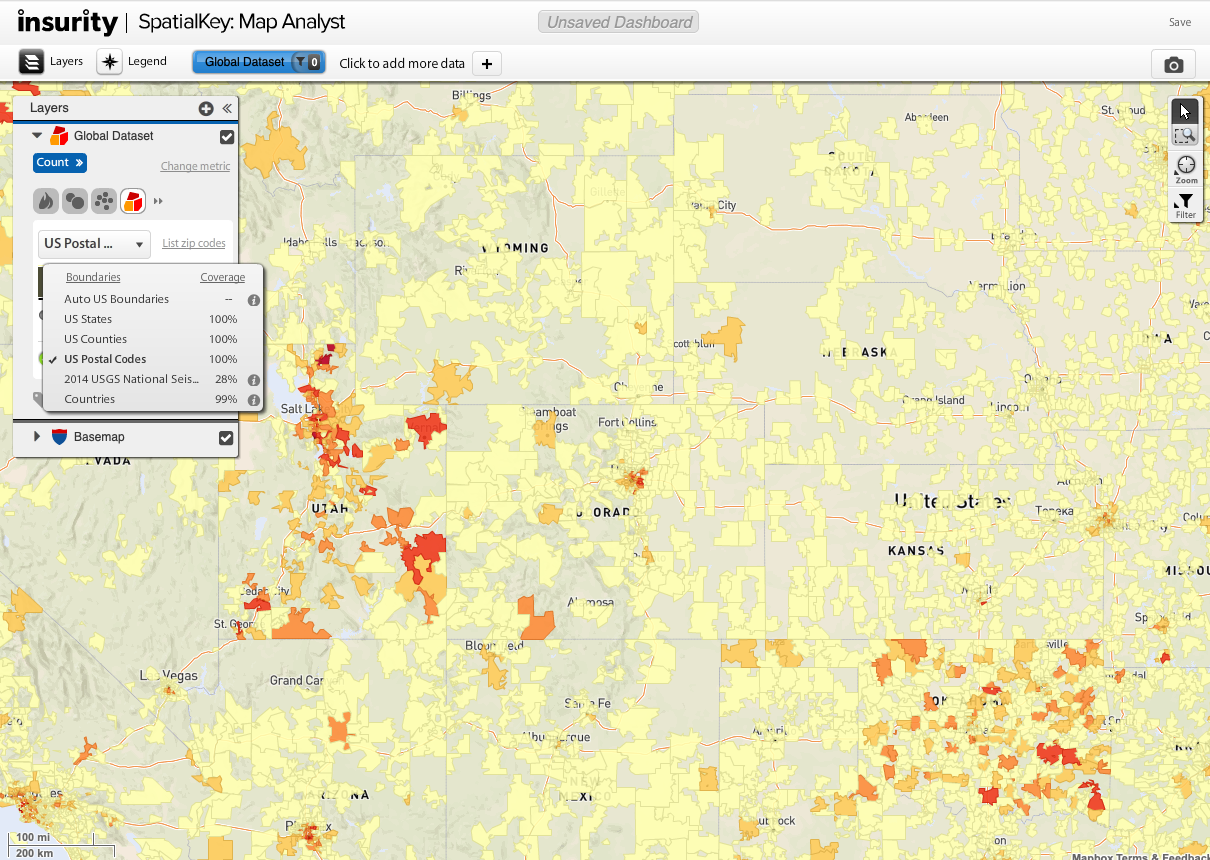
Let’s switch to the US Postal Codes boundary data to view detailed geographic distributions of our data. You may also need to zoom in to see this thematic view.
A little extra credit…
You can now leverage SpatialKey comparison mapping anywhere in the world! Whether it is an out-of-the-box geographic boundary used for standard thematic mapping (e.g. US County or US Postal Codes) or a custom shapefile that has been joined with your dataset, you can visually compare a metric between two data points thematically.
Image below: visualizing portfolio growth between 2011 and 2012 for a client’s Japan portfolio (dark green signifies larger growth)
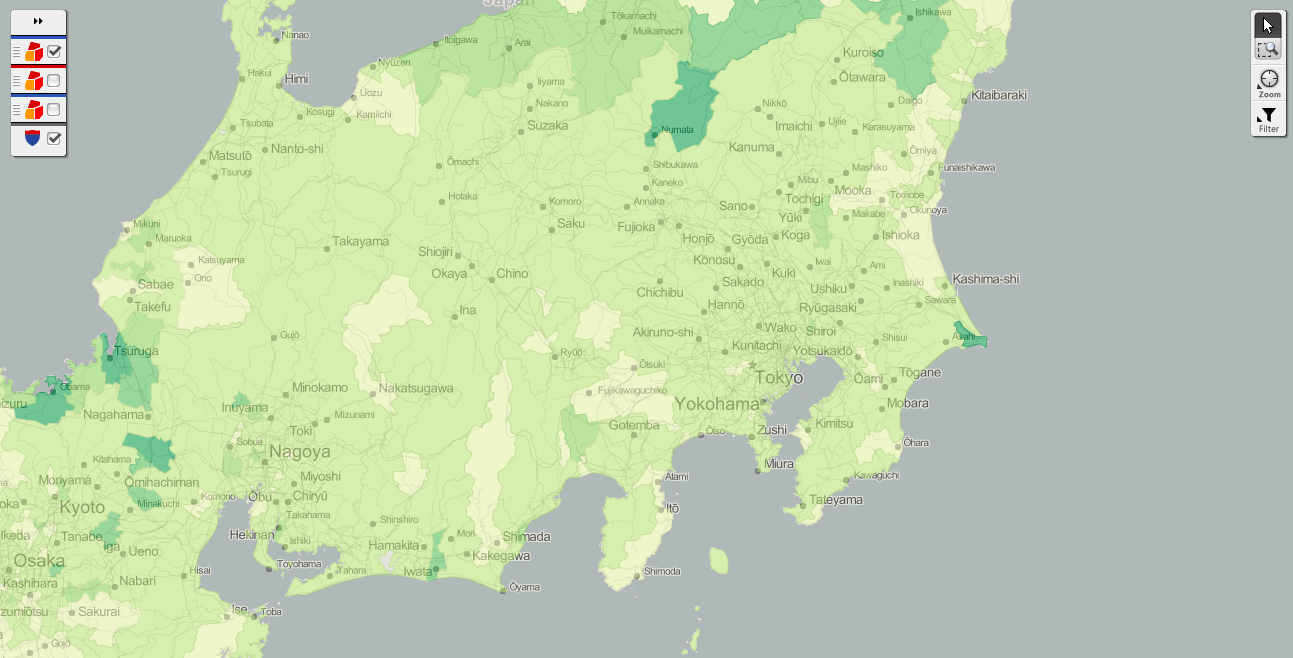
With comparison mapping, you can view portfolio growth, visualize premium adequacy, compare results from various models, perform market share analyses, and much more. Simply select any two data points and how you wish to relate them, and you will have a powerful map, telling you much about your data!
If comparing two data points within a single dataset, all thematic options for that dataset will be available. If comparing two data points within two separate datasets, only thematic options that are common between the two datasets will be available – e.g. CRESTA will only be available if both datasets have CRESTA enabled. For a refresher on comparison mapping, check out this article.