
Once your analysis runs, you’ll start with a summary view that shows how your locations perform across the selected hazards. Use the map to explore hazard layers, prospective risks, and any portfolio data, and click a location on the map or in the list to open a detailed location report with scores and mini-maps. You can sort and filter results using the list report in the right panel, then download summary or individual location reports as PDFs or export the list report as a PDF or CSV. Along the way, you can resize panels, pan the map, and adjust layers to focus on what matters most to you.
Visualize and Understand Results
- If you ran more than 1 location in your analysis, you’ll initially see a Summary Report of your risks based on all the hazards enabled for analysis. You can click on any bin from this report to get a filtered view of those results in the map tab.
- If TIV was provided & indicated on import of a schedule, the sum of TIV will be displayed for each bin of the scorecard. Note: If you entered a schedule manually (1 location at a time in the launcher) the sum TIV will not be displayed on the scorecard.
- With the map, you can visualize various hazard layers, prospective risks, portfolio or secondary datasets.
- Click on a prospective location (either on the map or in the list report) to pull up a Location Report and an info bubble that summarizes the scores for each analysis run. Location reports contain detailed information from the hazard enhancement as well as mini-maps to help you visualize all of the hazards together. All Location Reports can be downloaded as a PDF.
- A List Report (table view of each location) is provided of prospective risks enhanced with hazard information that you can use to sort and filter. The list report is available in the right panel when you aren’t viewing a location report. Each row has a report and globe icon that you can click to either pull up the report for the location or zoom to view it on the map.
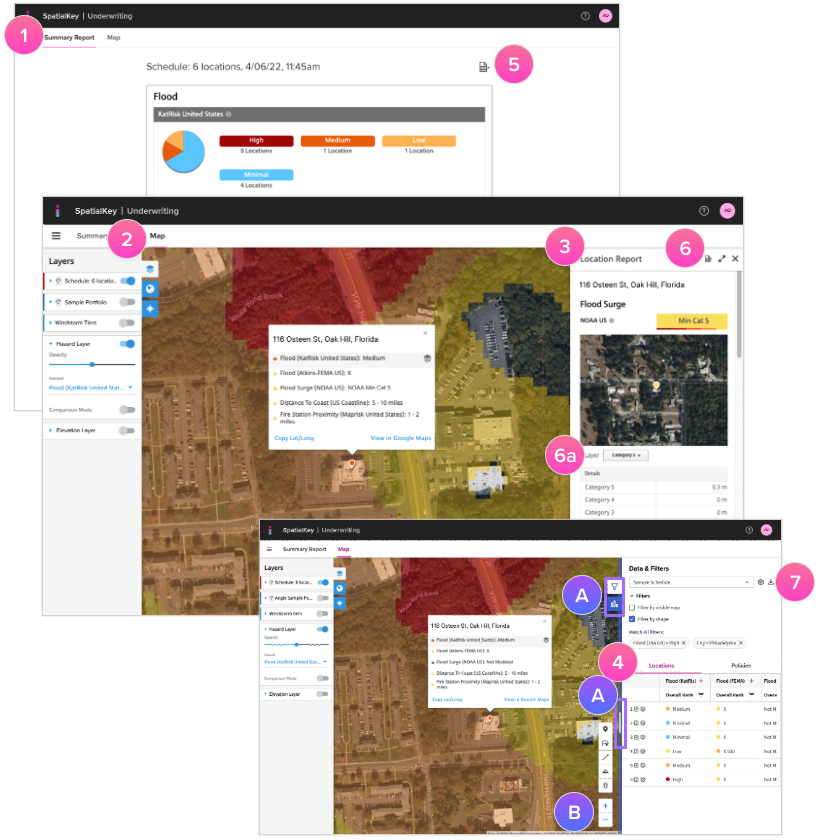
Download Reports
5. Download the Summary Report PDF for an overview of all schedule locations.
6. Download individual Location Report PDFs to keep record of newly written risks.
- A) If you want to adjust the visuals that are included in the location report PDF, adjust the map layers for each hazard before downloading.
7. The List Report is available as a PDF or CSV download. Fields shown in the PDF can be customized.
TIP!
- A) Click the arrows to expand or collapse the view. Drag the blue vertical bar to resize the right panel and get a better view of your data.
- B) Use your mouse to drag & pan the map. Use your mouse wheel or the “+“ & “-” buttons to zoom.
Was this helpful?