
The Accumulations App is portfolio-level and exploratory, designed to identify and rank peak concentrations across entire datasets using ring, grid, or target models, with richer visualization, filtering, and reporting tools for ongoing exposure management.
By contrast, the Underwriting Accumulation feature is submission-focused: it helps you evaluate the impact of adding new risks to your portfolio. It applies your specific underwriting guidelines—including rings or shapes, policy terms, and custom threshold criteria—to drive go/no‑go decisions at bind time.
Open the Accumulations App
To begin using the Accumulations App, simply click its tile in the Apps tab to open it.

Select Dataset
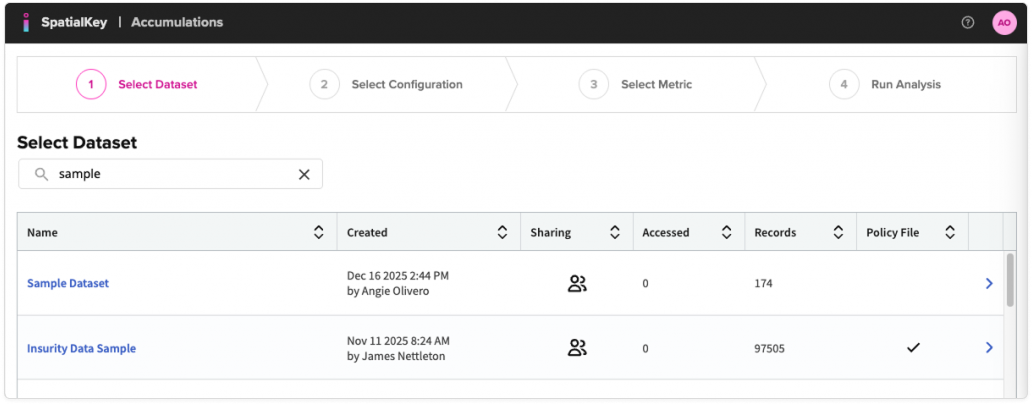
Once the application opens, your first step is to select the dataset you want to analyze. You’ll see a list of all datasets available to your organization—simply click the row of the dataset you want to use.
1. Select the dataset you want to analyze.
Select Configuration
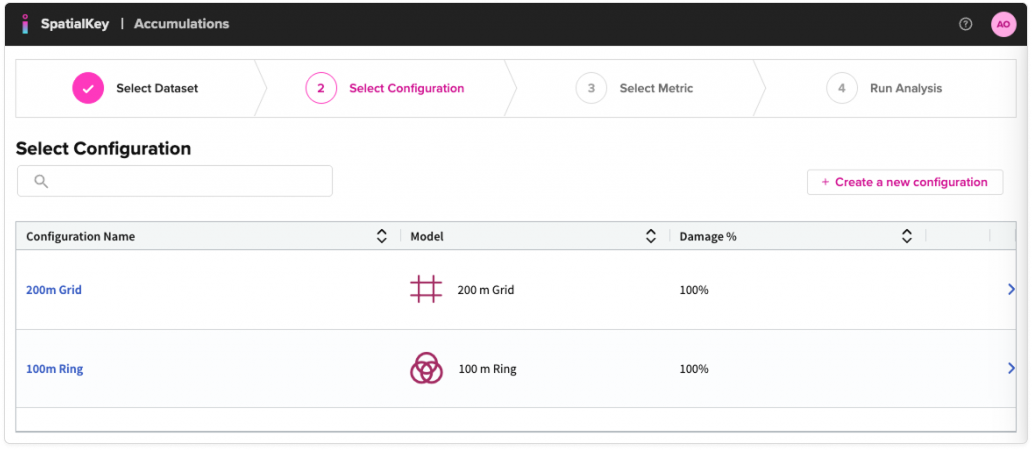
Then select the configuration for how the accumulations should be calculated—ring, grid, or target-based. With SpatialKey, you can identify peak exposure accumulations within overlapping rings, uniform grid sizes, or use a target dataset to identify areas of accumulation within a specific radius of those points.
2. Select the configuration you want to use.
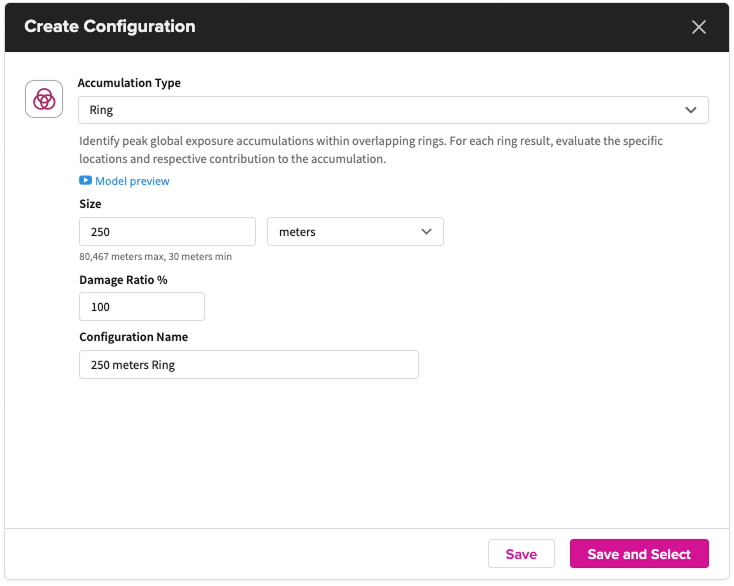
- Create a configuration if you don’t have one setup or want to create a new one. Select from available models for your organization. Each model has its own configuration options.
Select Metric
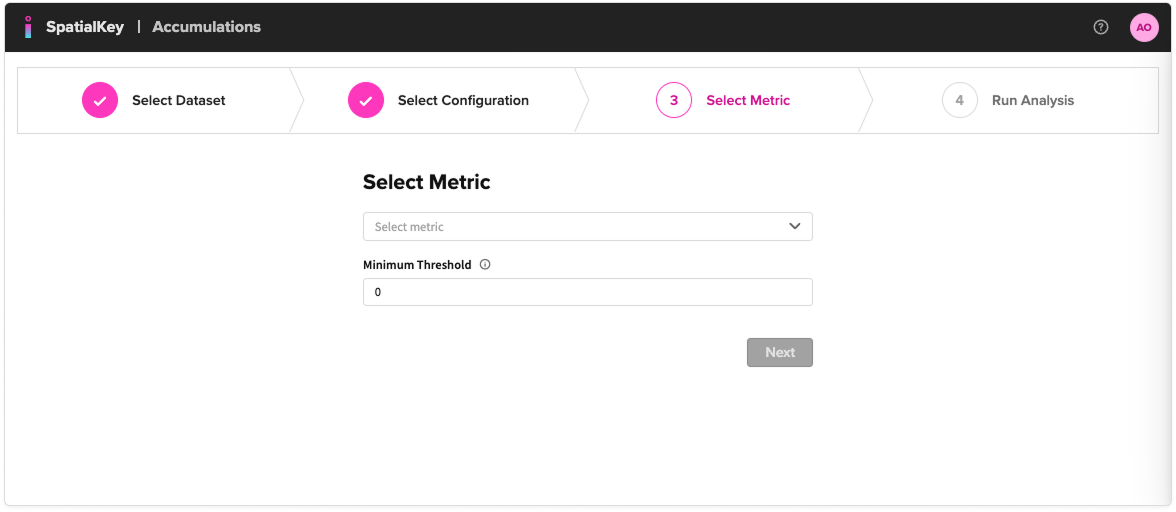
3. Select a metric and minimum threshold to use in the analysis. The minimum threshold can be left at 0 to have all accumulation results returned.
Models
You may have one or more of the following models enabled for your organization.
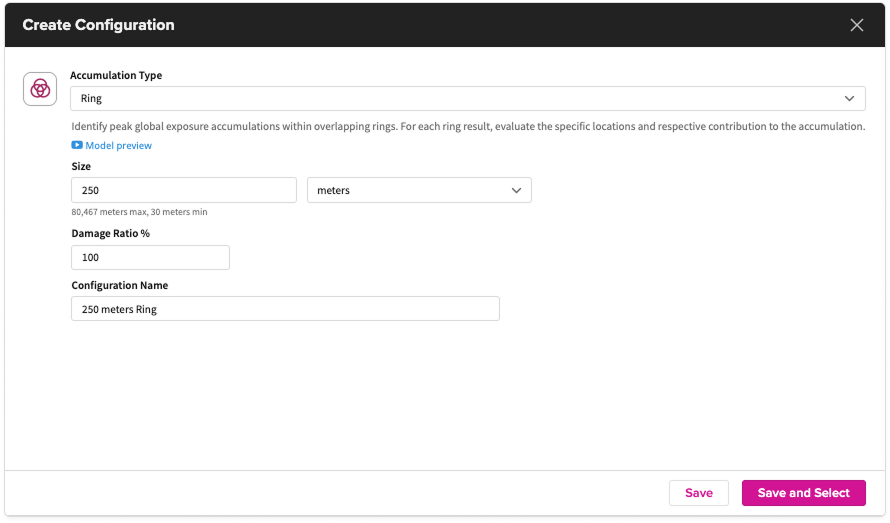
Ring
The ring model places overlapping (25%) rings over your locations, removes duplicates, and returns a list of your top accumulations. The ring radius size & damage ratio can be customized. Watch this animation to see how the ring model overlaps, identifies concentrations, and de-duplicates rings.
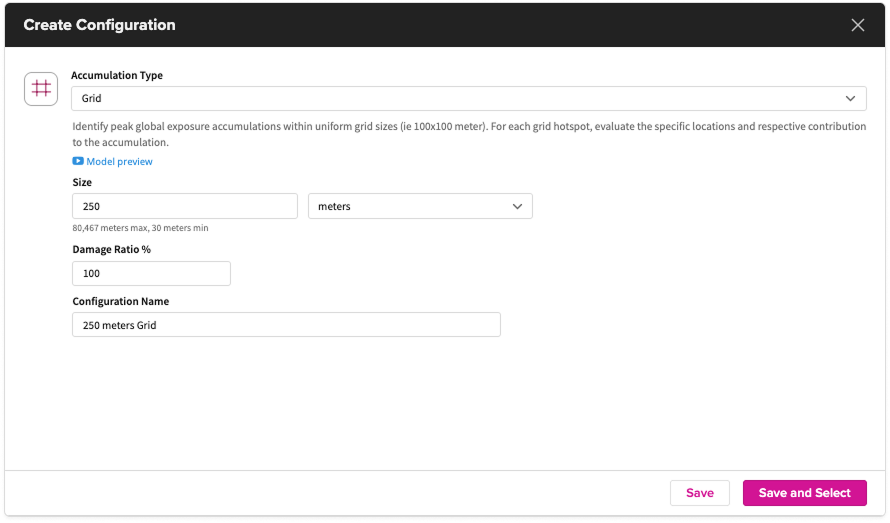
Grid
The grid model places overlapping (50%) grids over your locations, removes duplicates, and returns a list of your top accumulations. The grid size & damage ratio can be customized. Watch this animation to see how the ring model overlaps, identifies concentrations, and de-duplicates rings.
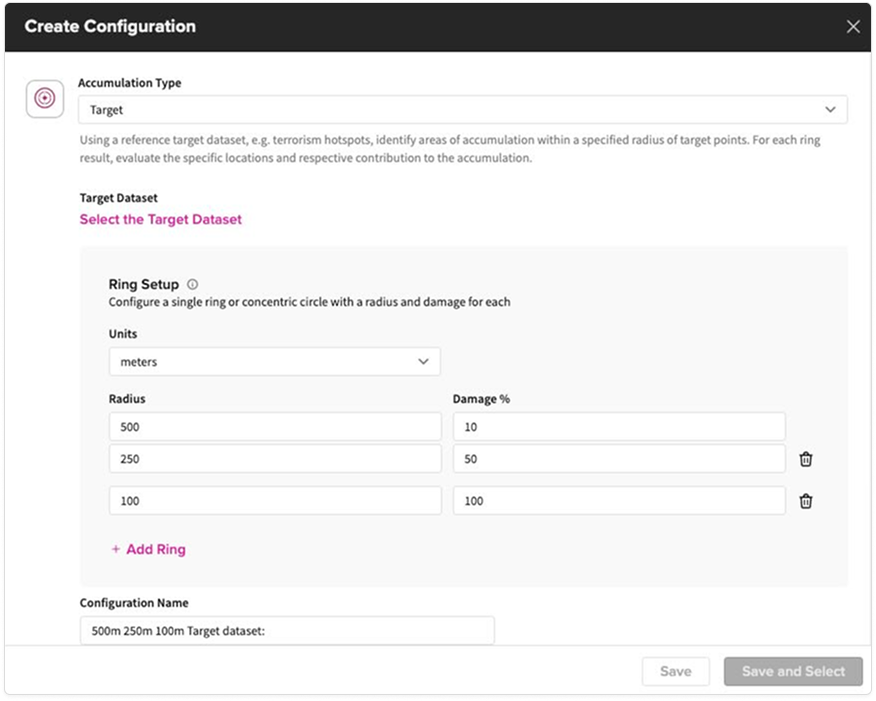
Target (including concentric rings)
The target model places rings centered around a reference dataset of your choice (e.g., terror targets, sinkholes), calculates the total locations within a specified radius, and returns a ranked list of accumulations. The number of concentric rings, ring size & damage ratio can be customized. This model is designed specifically to handle Terrorism scenarios like Lloyd’s Realistic Disaster Scenarios (RDS).
Run Analysis
When you run the analysis, SpatialKey automatically finds and ranks your highest exposure areas so you can quickly focus on where risk is concentrated.
Next let’s visualize and understand your Accumulation results.
Was this helpful?