
| Note: This feature is available in SpatialKey Client for Windows applications, i.e., Map Analyst, Hazard Analyst and Accumulations. |
You can quickly filter your data geographically by adding shapes to your map. You can add simple circles and rectangles as well as more complex polygons. When you add these shapes you can turn data filtering on to see your data filtered within the shapes.
Adding Shapes
To start using shapes you can add a new Shape Layer to your map by clicking the 
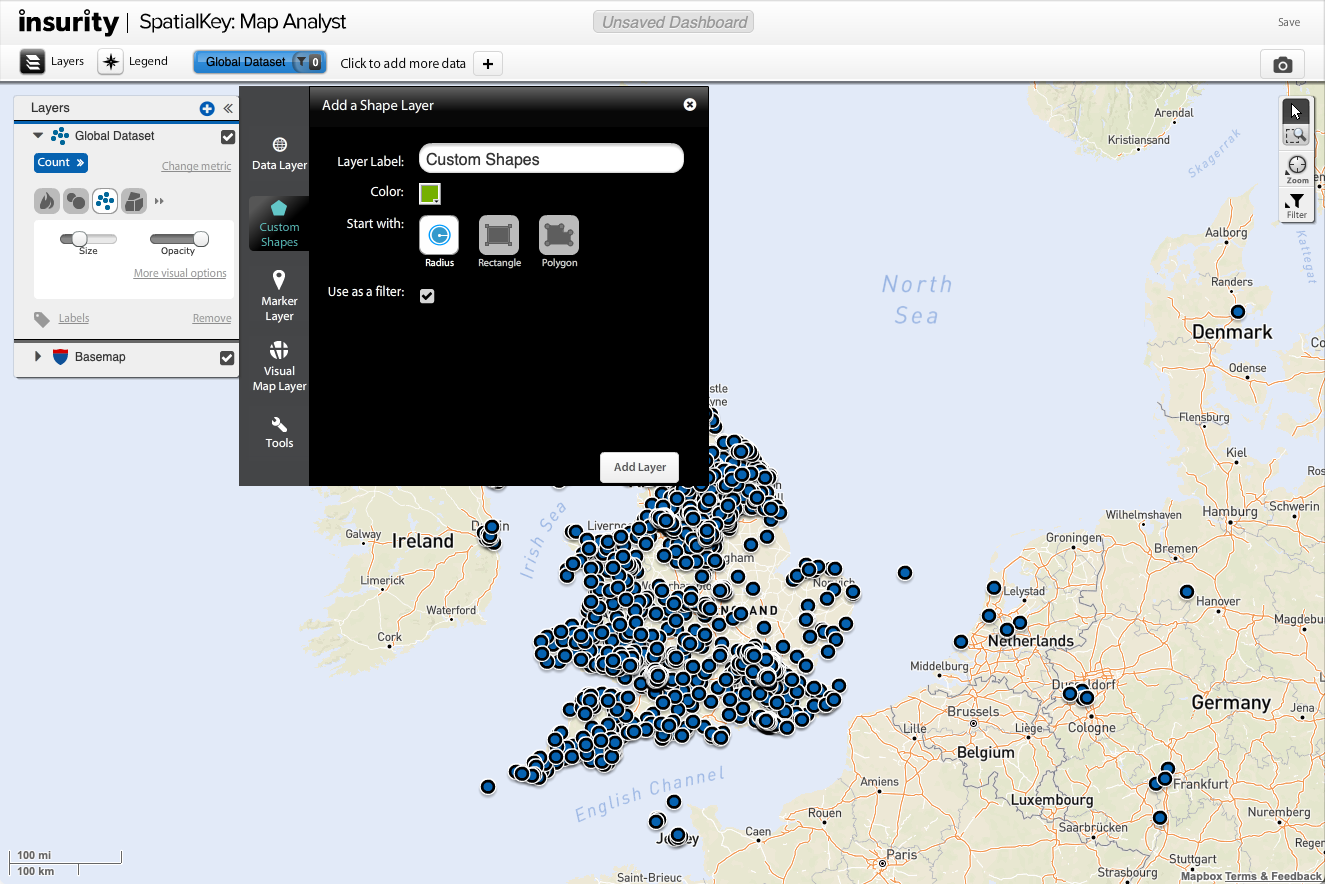
Select to add either a Circle, Rectangle, or Polygon. If you’re trying to do some quick filtering around a certain area then adding a circle or rectangle might be all you need. If you’re trying to outline a very specific area on the map then you should add a polygon. Check to “use as a filter” if you want data on your map filtered by the shape layer.
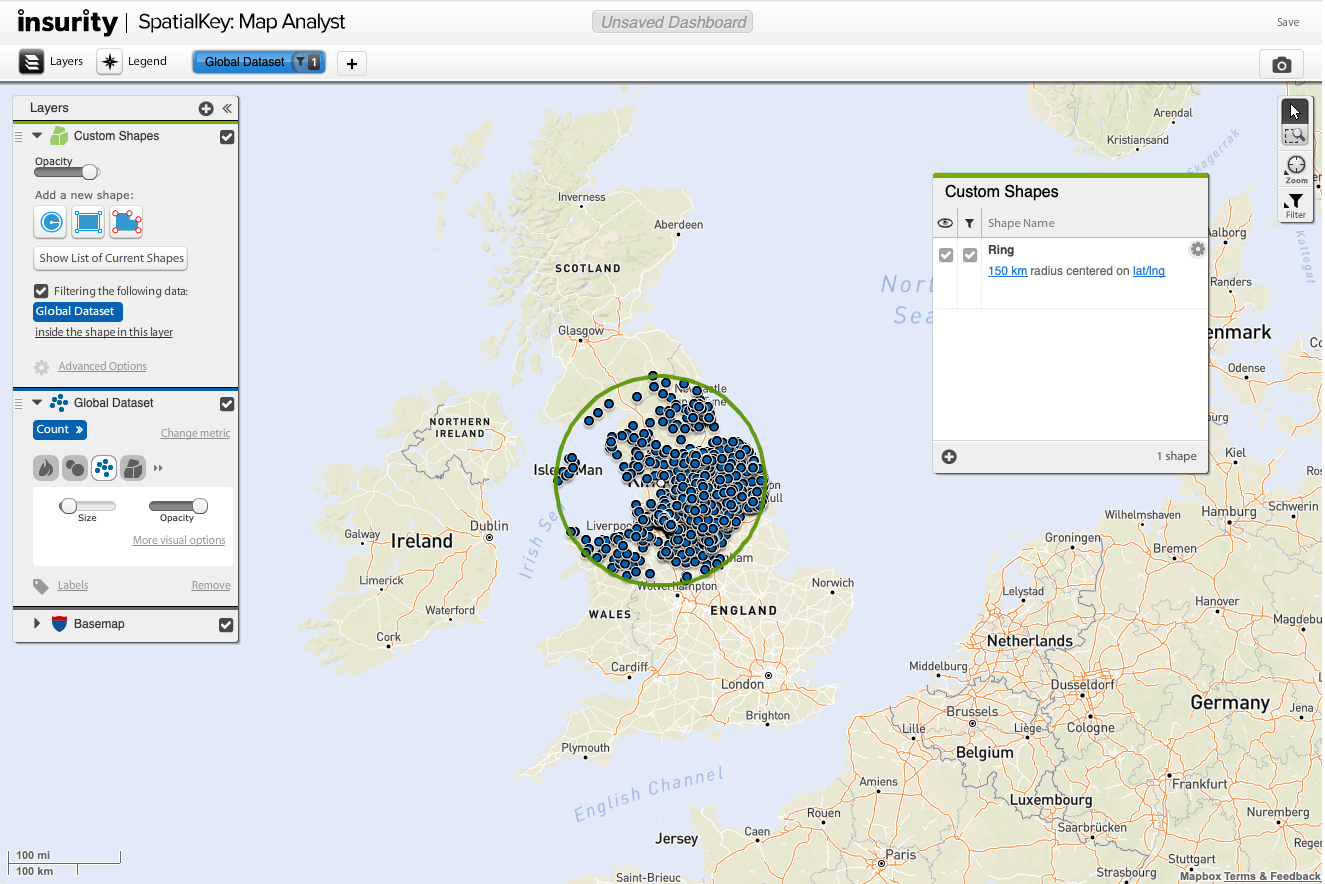
Once you add the custom shape layer it will show up in your list of layers and the shape you added will appear on the map in edit mode. While the shape is in edit mode, you can customize its size and position before applying it to the map. Move shapes around the map by dragging the bar at the top of the shape. Resize using the white handles at the edge of the shape.
Click “Apply” in the shape header when done. Notice that the location dataset is filtered by the newly added shape since we had selected to “use as a filter” when we added the shape.
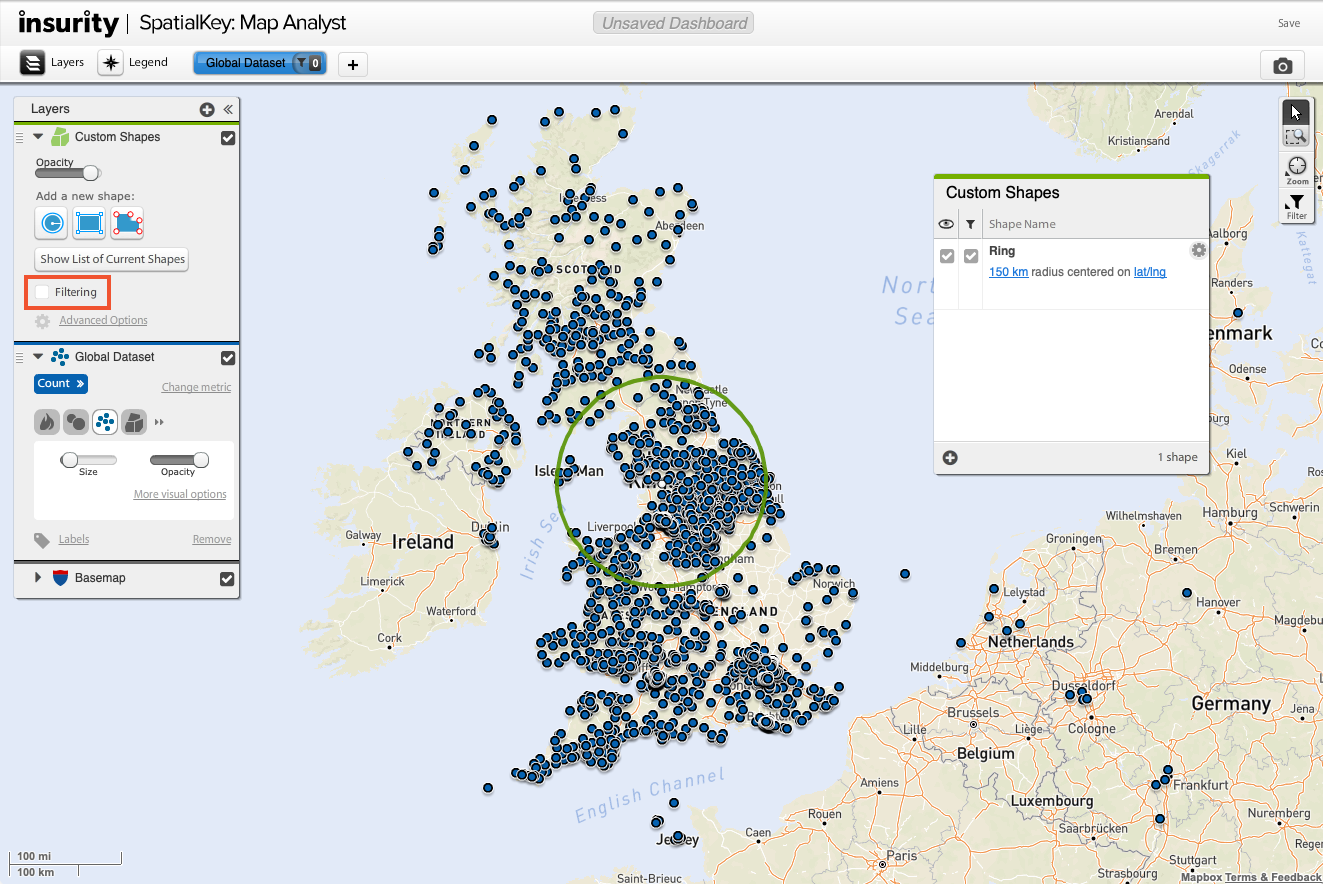
If you want to change this setting, simply uncheck the “filtering the following data:” checkbox in the custom shape layer in the layer manager.
You also have the flexibility of filtering data outside of a custom shape. This is managed in the advanced options for the custom shape layer in the layer manager. Select to “disclude all” on the filter settings tab.

To edit a shape that has been applied to the map, click the shape in the map or click the gear in the custom shape pod and select “edit”. If you clicked on the shape, a gear will appear in the upper right corner of the header so that you can access editing options.

If you need to remove a shape that you’ve added you can click the gear while in edit mode or within the custom layer pod and select “delete”. The shape will be removed from the map and will no longer be used to filter your data, if you had that setting enabled.
One additional option that is unique to custom circles is that you can set the center of the circle at a specified address. To do this, click on the shape and select the gear that appears in the upper right corner of the header. Select “change radius/address”.
Polygons
All of the information in the above section applies to polygon shapes also, but there are a few additional items to mention when discussing polygons.
When the polygon is added you’ll see the shape on the map with white points at each of the polygon’s vertices. You can grab each of the red vertices and drag them into place.

In the example below, I’m trying to place a polygon around the park in the north most part of San Francisco.
The default polygon does a pretty good job at surrounding the park, but some water and street areas are included in the shape. To remove these areas from the shape, we will need to add more points to the shape. Click on the black mid-points between the white vertices. When you click on the black mid-point it will turn it into a new vertex and then you can drag it into place. This allows you to add more points to the polygon by clicking on the black mid-points as many times as you need to. Notice how my polygon shape now hugs the park boundary in the image below.

If you added too many vertices to your polygon, you can remove them by selecting the option to “erase points”.
You’ll notice a white eraser around the mouse cursor now. Click on a point to erase it.

Once a point is erased, the point will be removed and the polygon will snap to a straight line between the two surrounding vertices.
