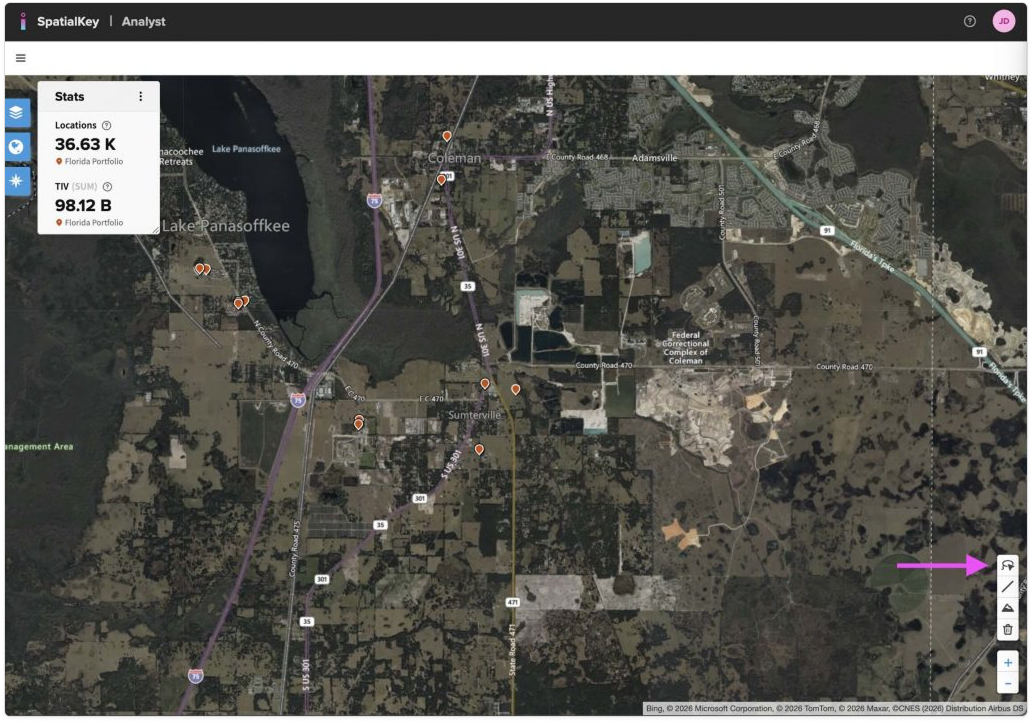
SpatialKey offers filtering based on proximity to a specified address.  To set this up, simply add a custom circle shape to your map.  Click the Drawing Tool icon in the Toolbar Manager to open your custom shape filters.

A satellite map view showing a rural area in Florida with location markers and active stats displayed in the upper left. On the right side of the map, an arrow points to the Custom Shape Drawing tool in the map toolbar. This tool allows the user to draw a custom shape directly on the map to select areas, filter locations, and update stats and visuals based on the drawn boundary.
Drawing Tool

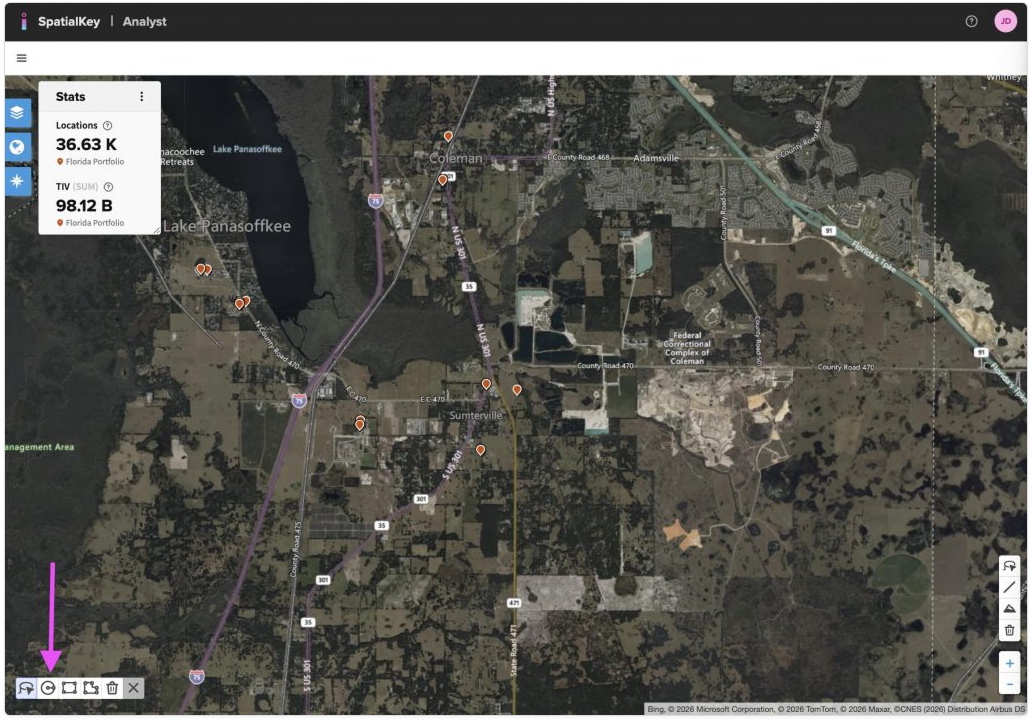
Select to add a Circle.  Move shapes around the map by dragging the shape.  Resize using the white drag handles at the edge of the shape.

A satellite map view showing a rural area in Florida with location markers and active stats displayed in the upper left. At the bottom left of the map, the drawing toolbar is open, displaying icons for drawing and editing shapes. An arrow points to the expanded toolbar, indicating where users can select drawing tools to create custom shapes for filtering and spatial analysis.
Circle Drawing Tool
A satellite map view showing a circular custom shape drawn over a rural area in Florida. The shaded circle represents a user‑defined boundary created with the map drawing tools. In the upper left, the Stats panel updates to show counts and total insured value for locations within the drawn area. On the right, the Data & Filters panel indicates that filtering by drawn shapes is active and displays a table of locations limited to those inside the circle.
Move or resize shape

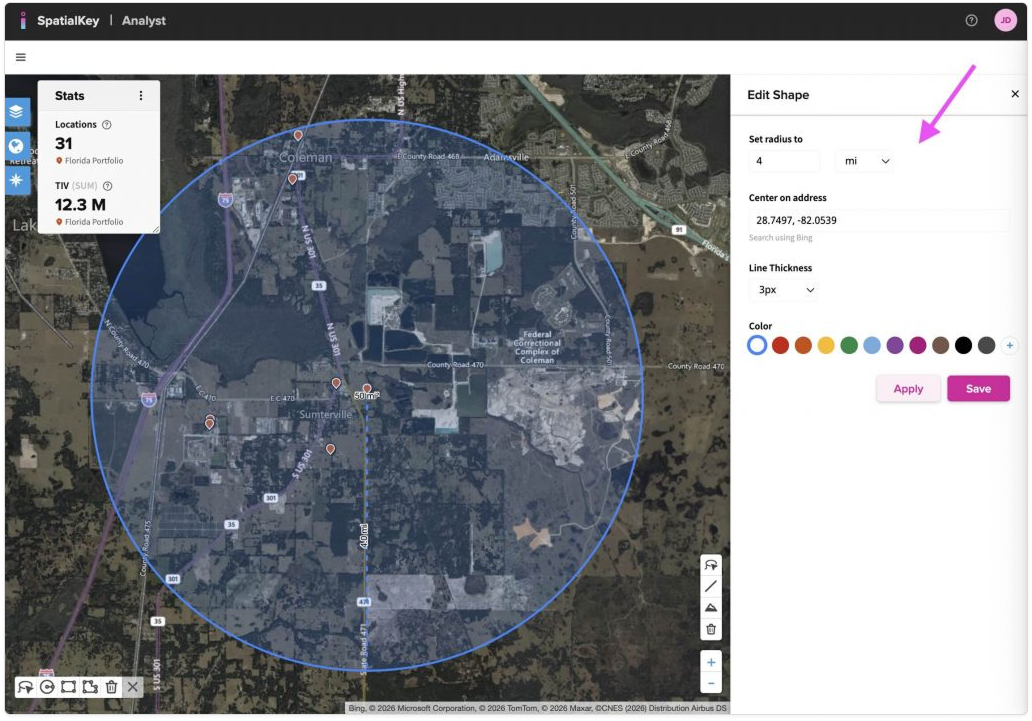
Click the shape to open the Edit Shape panel on the right. From there, you can set a specific radius in feet or miles, enter an address or latitude/longitude to center the circle, and adjust the line color and thickness. Click Apply to preview your changes, then Save when you’re ready.

A satellite map view showing a circular custom shape drawn over a rural area in Florida. On the right, the Edit Shape panel is open, displaying options to adjust the shape. An arrow points to the ‘Set radius to’ control, indicating where the user can change the circle’s radius in miles. Additional controls allow the user to update the center address, line thickness, and color, with Apply and Save buttons at the bottom. The Stats panel in the upper left updates based on the edited shape.
Edit Shape Panel

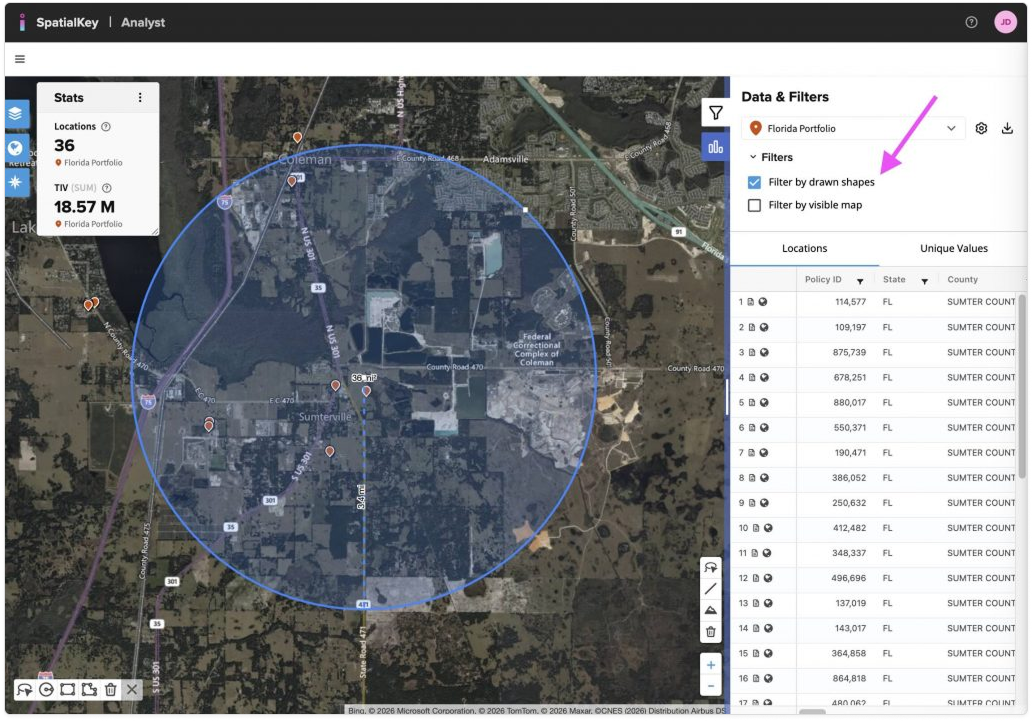
Your custom shape will be centered on the entered address. After closing the Edit Shape panel, you’ll see a Filter by drawn shapes checkbox in the List Report. When selected, both the list and map are filtered to the custom shape you drew. Uncheck it to view all locations alongside the shape.

Screenshot of the SpatialKey Analyst web map showing an aerial map with a large blue circular drawn shape used as a filter over a rural area in Florida. The right-side “Data & Filters” panel shows “Filter by drawn shapes” enabled under the Florida Portfolio, indicated by a highlighted control and a magenta arrow. The locations table lists policies limited to the drawn area, all in Sumter County, FL. A stats panel on the left summarizes 36 filtered locations with a total insured value of $18.57M.
Filter by drawn shapes

It’s really that simple to set up a filter around an address.  Just set up a custom circle and you are a few clicks away from filtering your data around a custom address.  For more detail, check out this article on Custom Shapes.

Was this helpful?

Yes

No


Thanks for your feedback!

Tagged: