| Note: This feature is available in SpatialKey Client for Windows applications, i.e., Map Analyst, Hazard Analyst and Accumulations. |
Have you ever wanted to display a ratio in your dashboard based on 2 fields from your dataset? Have you ever wanted to display the sum of multiple fields? Have you ever wanted to calculate the average price per square foot for real estate in your dashboard?
With SpatialKey’s advanced calculations feature, you can now do all of these things and more!
There are a couple of ways to use advanced calculations in your dashboard. You can use them both in visualization pods and map layers:
- Map layer (heat, graduated circles, thematic, bivariate)
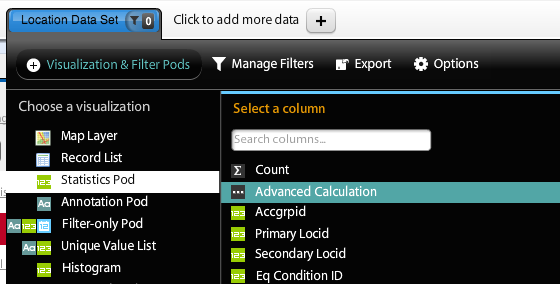
- Statistics pod
- Unique value list
- Histogram
- Timeline and other date pods
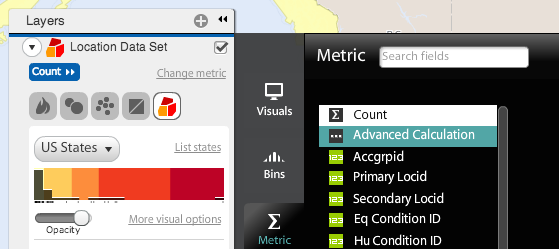
To access an advanced calculation, simply select the “Advanced Calculation” option when selecting a metric. See example below for the Statistics pod.
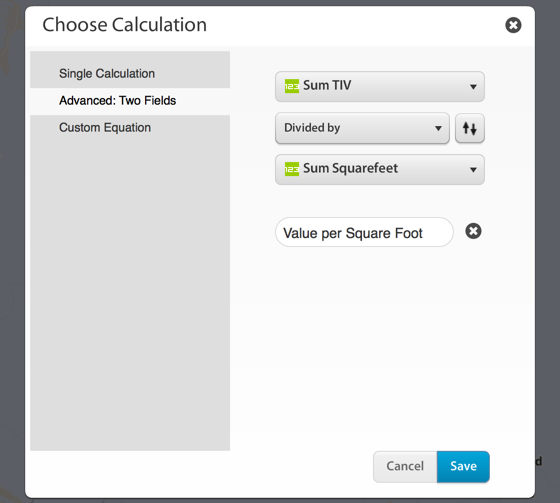
You can calculate simple ratios, summations, differences, etc. or create your own custom equation if you have more complex needs. You can optionally add a custom label for your calculation as well.
Use our wizard for some simple calculations between two fields:
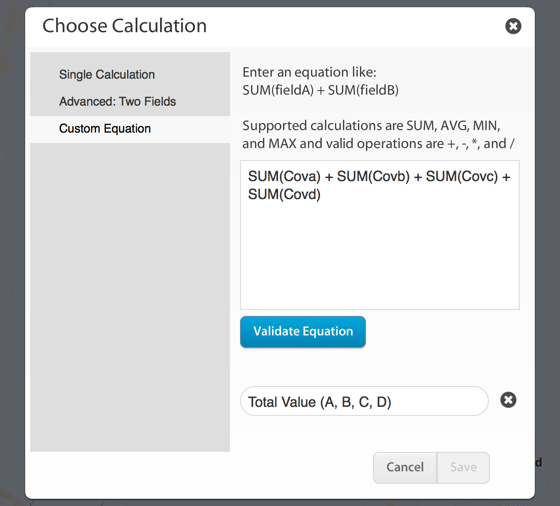
Or type out your own equation, similar to Excel:
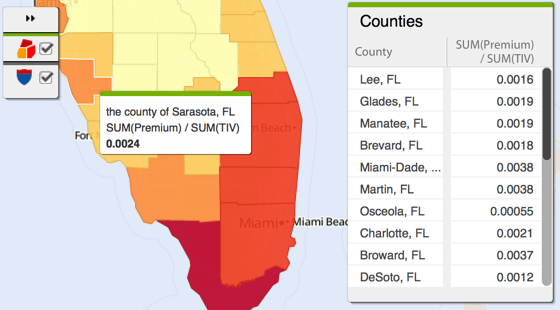
Advanced calculations work in most of the visualization pods, and can also be a powerful way to visualize your data on the map.