
This Analysis Tools article introduces the built-in tools that help you summarize, explore, and interrogate your data directly on the map. You can add statistics to quickly understand totals and key metrics, and use Unique Value Lists to group and aggregate data by any location or policy attribute—making it easy to spot concentrations, compare values, and filter results across datasets.
You’ll also find interactive map tools for deeper spatial analysis, including distance measurement, elevation lookup, elevation profiles, and detailed location inspection. These tools let you measure proximity, understand terrain, and drill into individual records, helping you move seamlessly from high-level summaries to precise, location-specific insights.
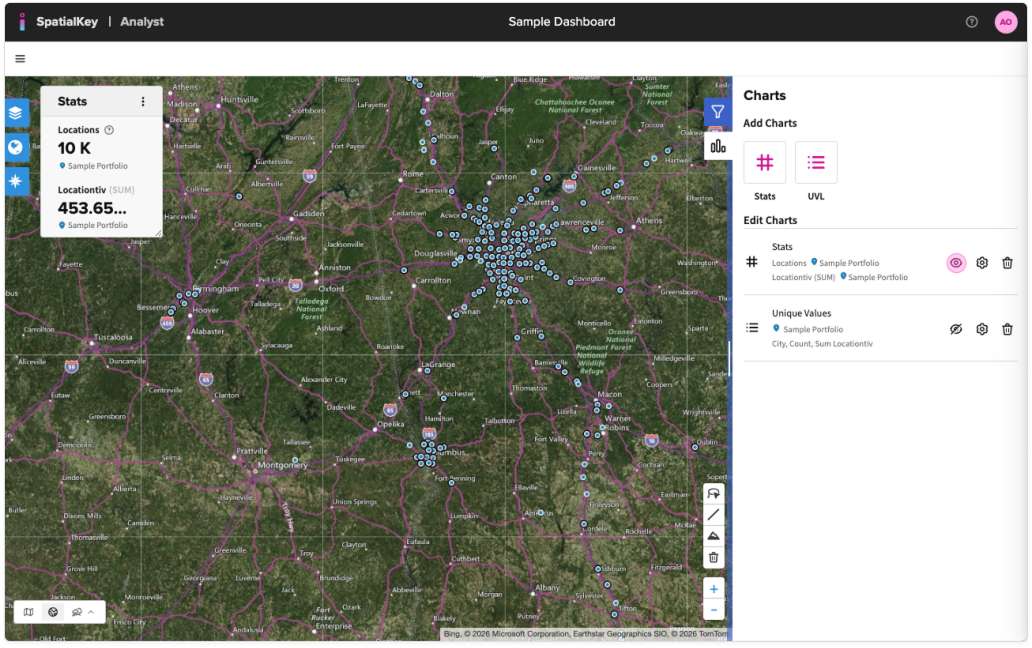
Statistics Panel
By default, you’ll see a Stats pod in your dashboard with total location count and the sum of the metric selected for the analysis or TIV (if available).
You can add additional statistics to your dashboard by clicking the more menu icon in a stats pod or by clicking the “Stats” icon under “Add Charts” in the right panel.
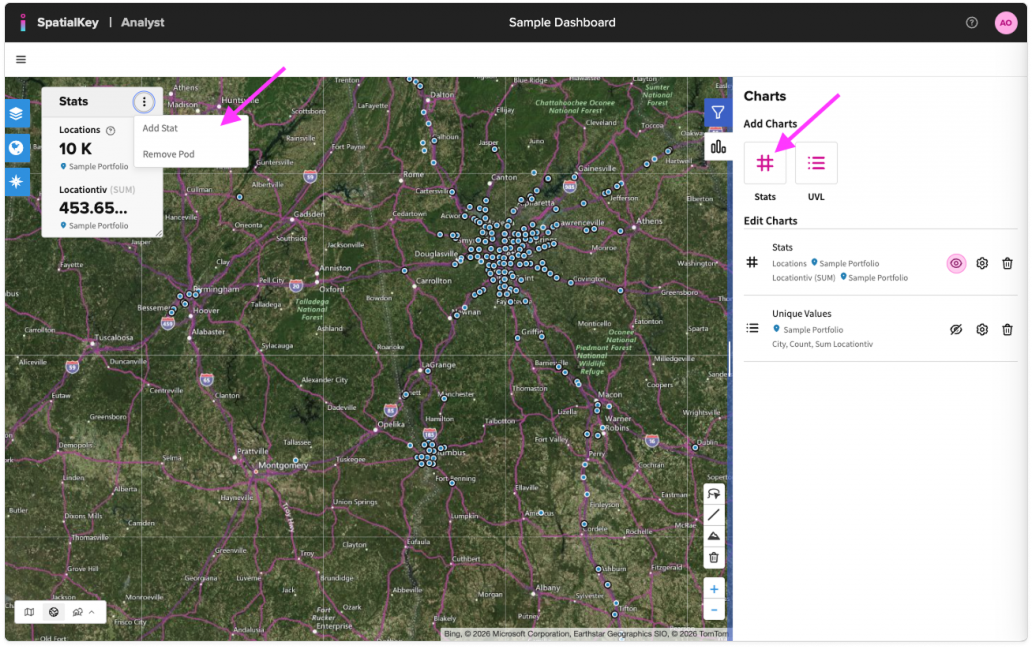
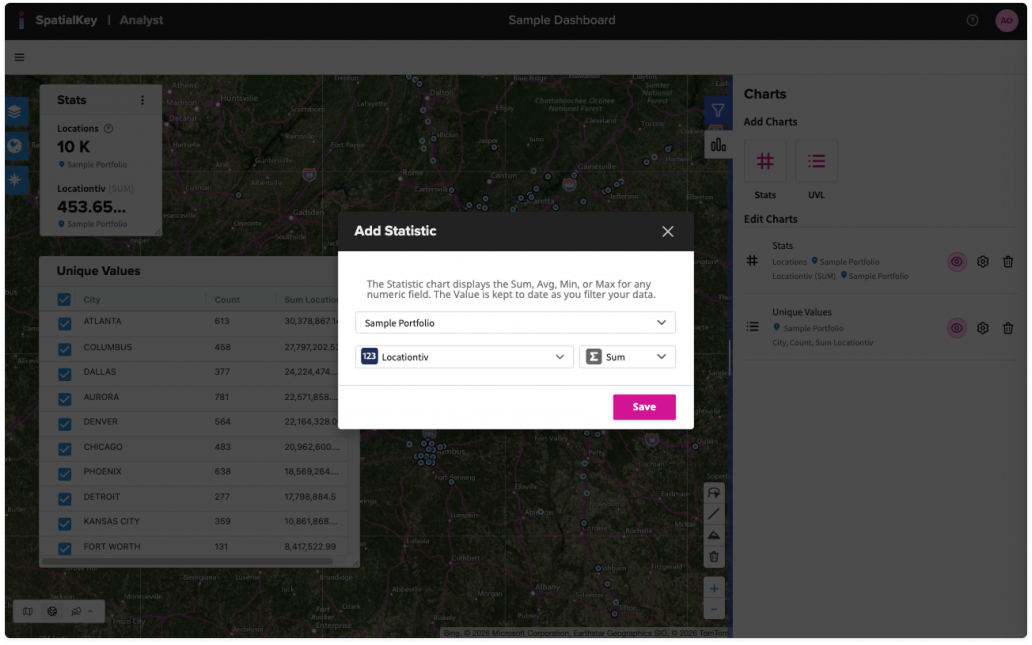
Select from any numeric value in your dataset and aggregate by Sum, Avg, Min or Max. The Stats pod will appear, and you can drag it anywhere on your map.
Unique Value Lists (UVL)
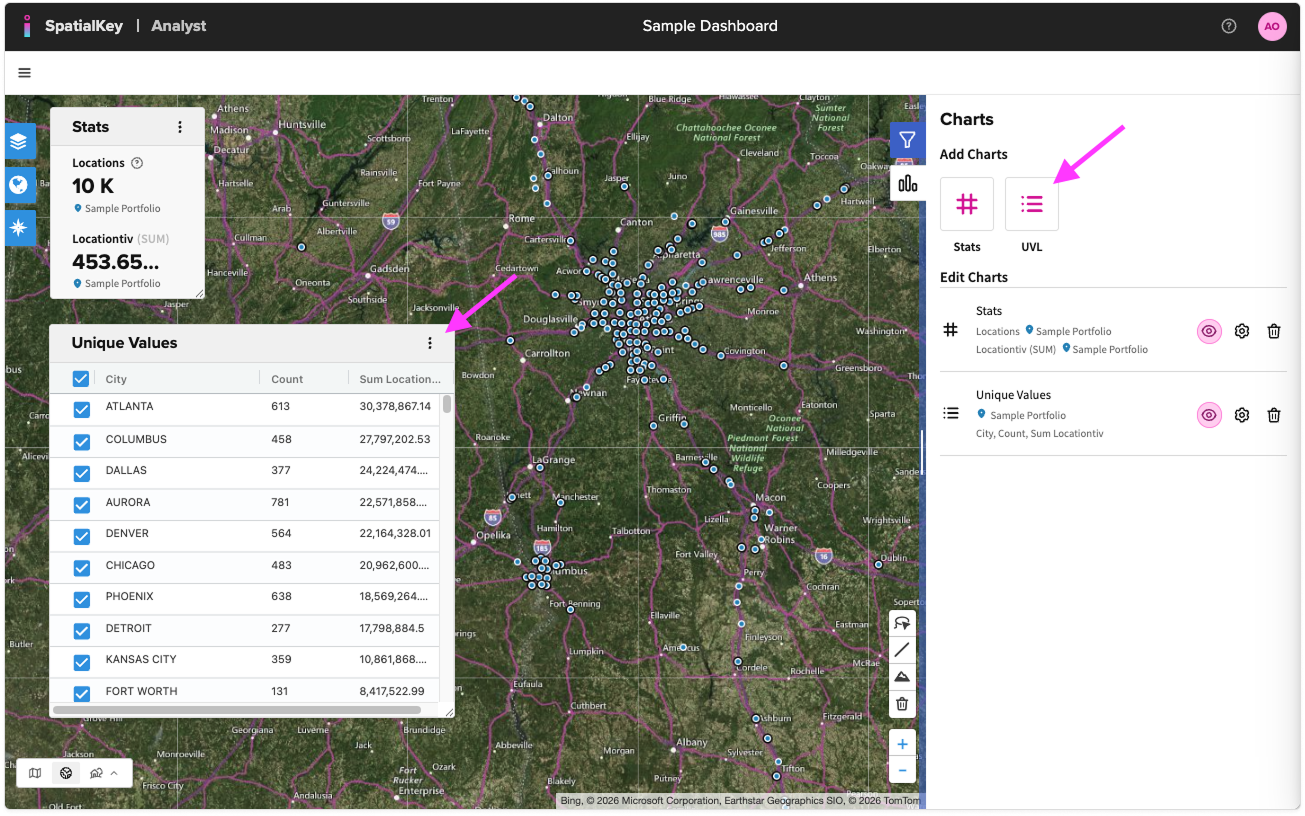
Next to the Stats button in the Charts panel, you’ll find the Unique Value List (UVL) button. Click the button and then select any column from your location or policy file and the metric you want to aggregate.
The UVL will pop up with your unique values and aggregates. You can drag the pod anywhere on your map and use the rows to filter your data.
Measurement Tools & Location Details
- Distance Tool
The distance tool allows you to measure the distance between any points on the map. You can add as many vertices to your ruler as you wish. - Elevation Profile
To visualize the elevation across the ruler that you drew with the distance tool, hover over the line to view the elevation profile. - Elevation Tool
Use the elevation tool to look up the elevation for any single point on the map. - Location Details
Hover and click a location to see all the details of that location.
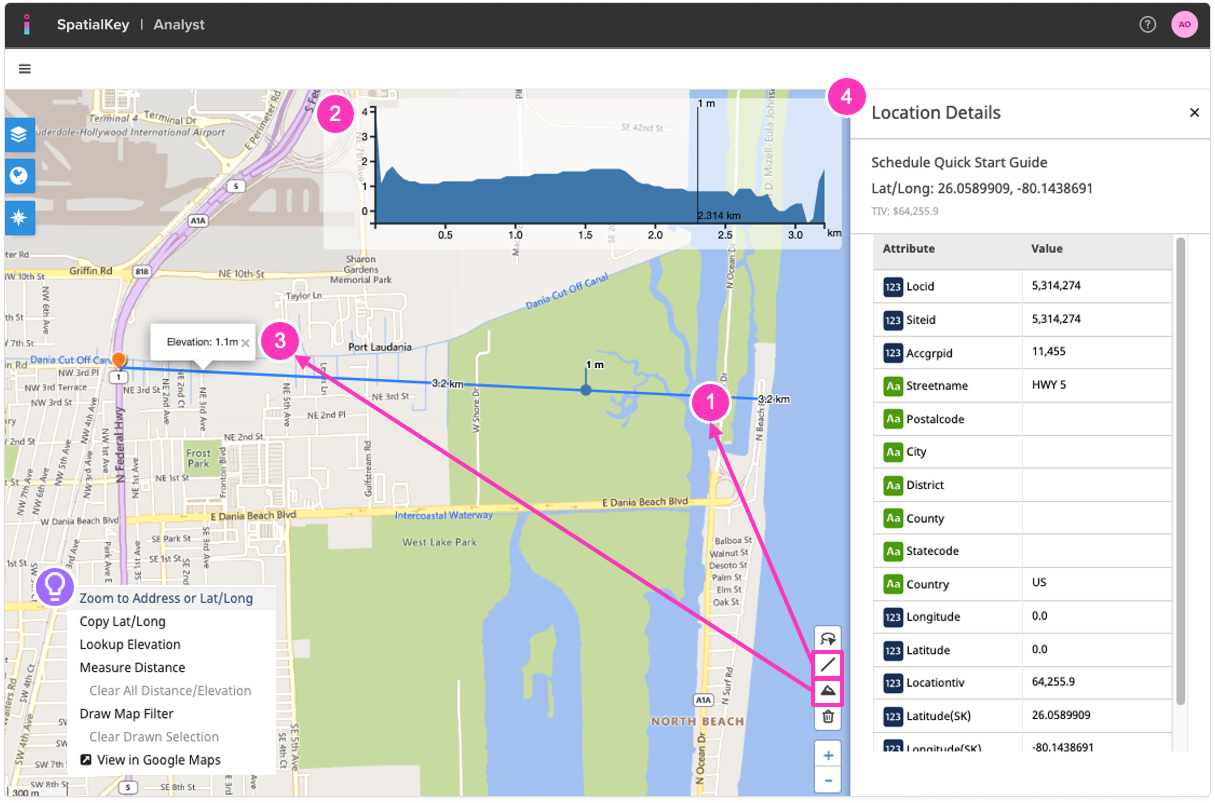
TIP! The distance tool and elevation tool can also be accessed by right clicking anywhere on the map. Additional tools accessible in the right-click menu:
- Ad Hoc Lookup (available only in the Underwriting app): Use the ad hoc lookup to drop a new point on the map and start an ad hoc analysis of a new location or of different corners of the building you are analyzing.
- Zoom to Address or Lat/Long
- Copy Lat/Long
- View in Google Maps
Was this helpful?