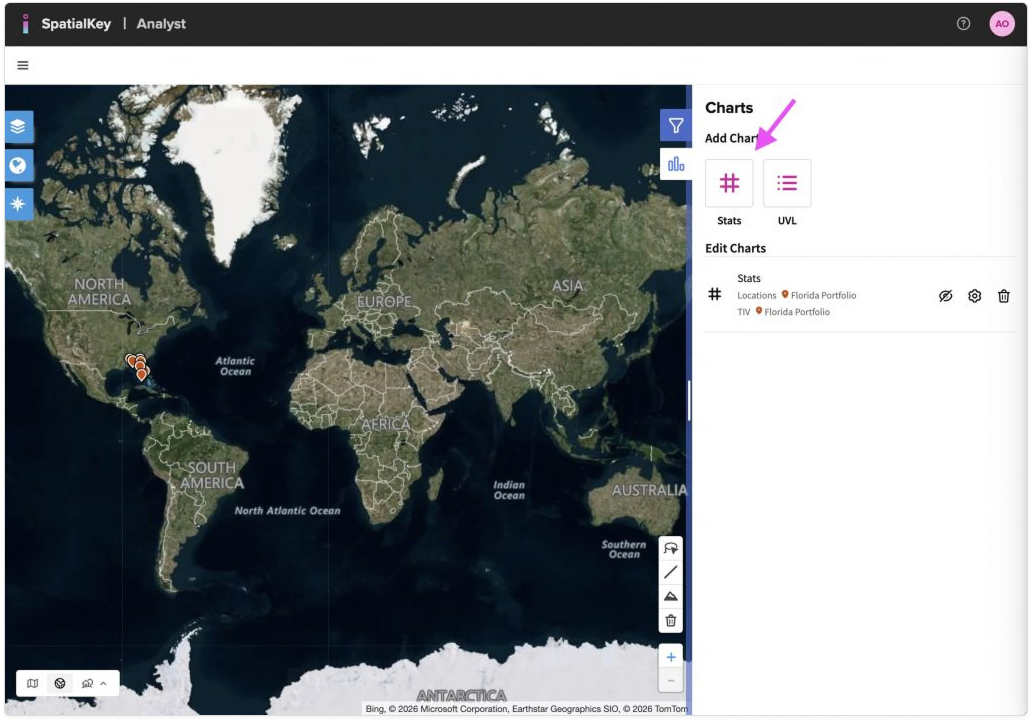
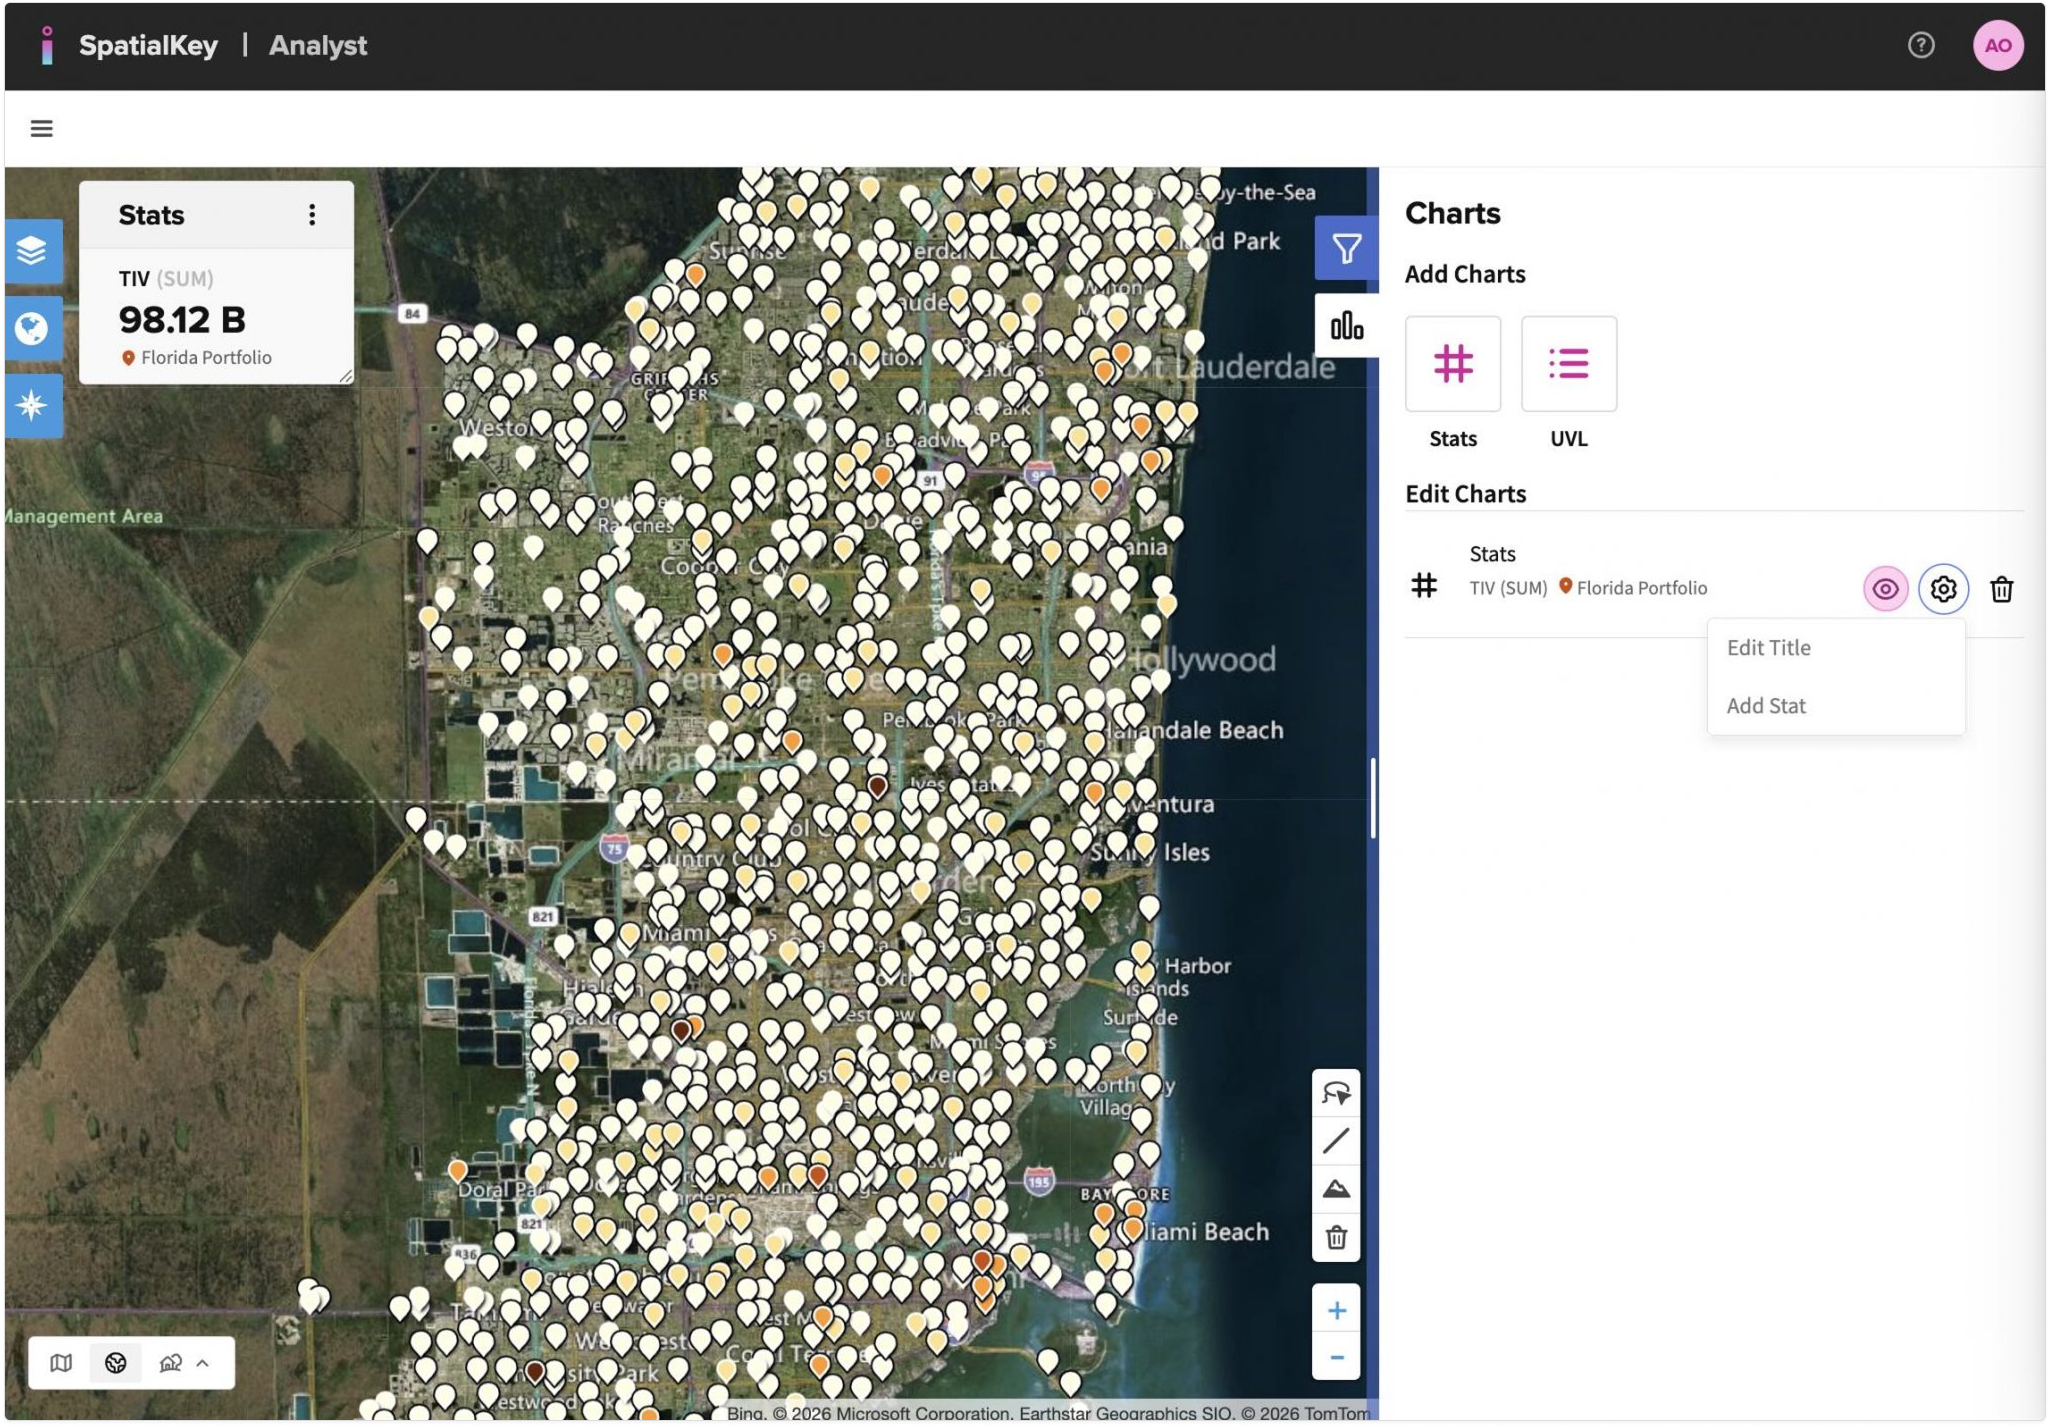
SpatialKey’s Stats pod provides a way to add custom summary statistics to your dashboard views. Add a Stats pod from the Charts panel on the right side of the map.

SpatialKey showing a world map on a satellite base layer. On the right, the Charts panel is open under ‘Add Charts.’ An arrow points to the ‘Stats’ button, indicating where users can click to create a new custom stats pod. Existing stats for the selected portfolio are listed below, with the map visible in the background.
Add Stat from the Charts panel

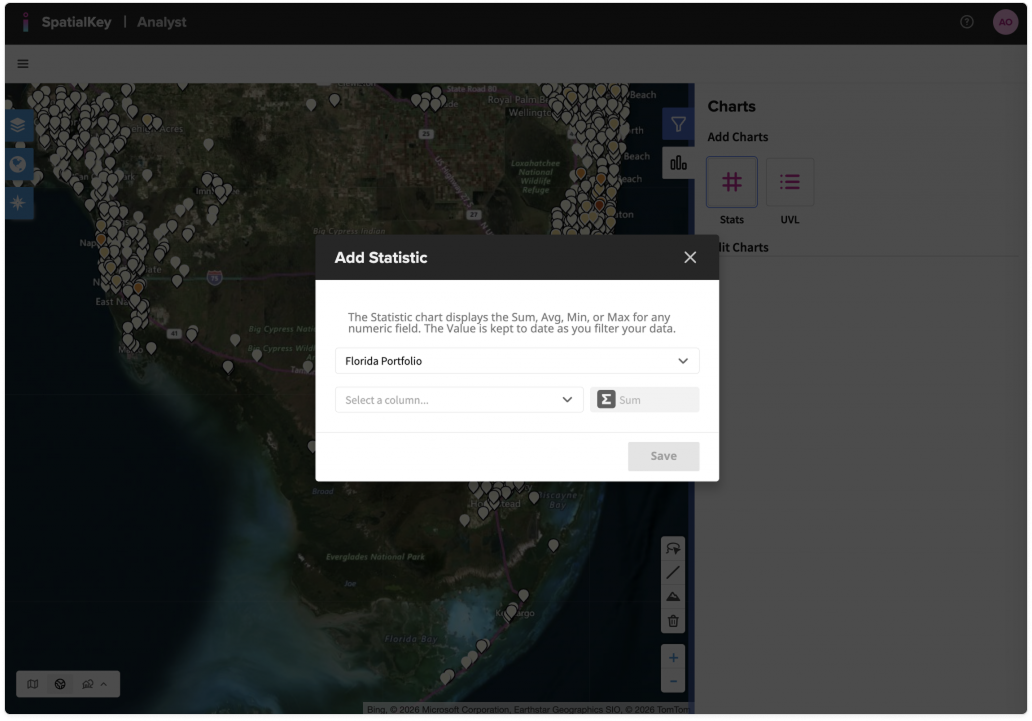
Select a dataset and a numeric field for the calculation, then choose an aggregation method: Sum, Average, Minimum, or Maximum.

A world map is visible in the background with a modal dialog titled ‘Add Statistic’ displayed on top. The dialog allows the user to create a custom stats pod by selecting the Florida portfolio, choosing a numeric field, and applying an aggregation such as sum, average, minimum, or maximum. A Save button appears at the bottom of the dialog, with the Charts panel visible behind it.
Select your dataset and numeric value.

A map showing a dense cluster of location markers over southeast Florida. In the upper left, a Stats pod displays ‘TIV (Sum)’ with a value of 98.12 B for the Florida portfolio. On the right, the Charts panel lists the active Stats pod for total insured value, corresponding to the locations displayed on the map.
Example Stats pod with the Sum of the TIV column

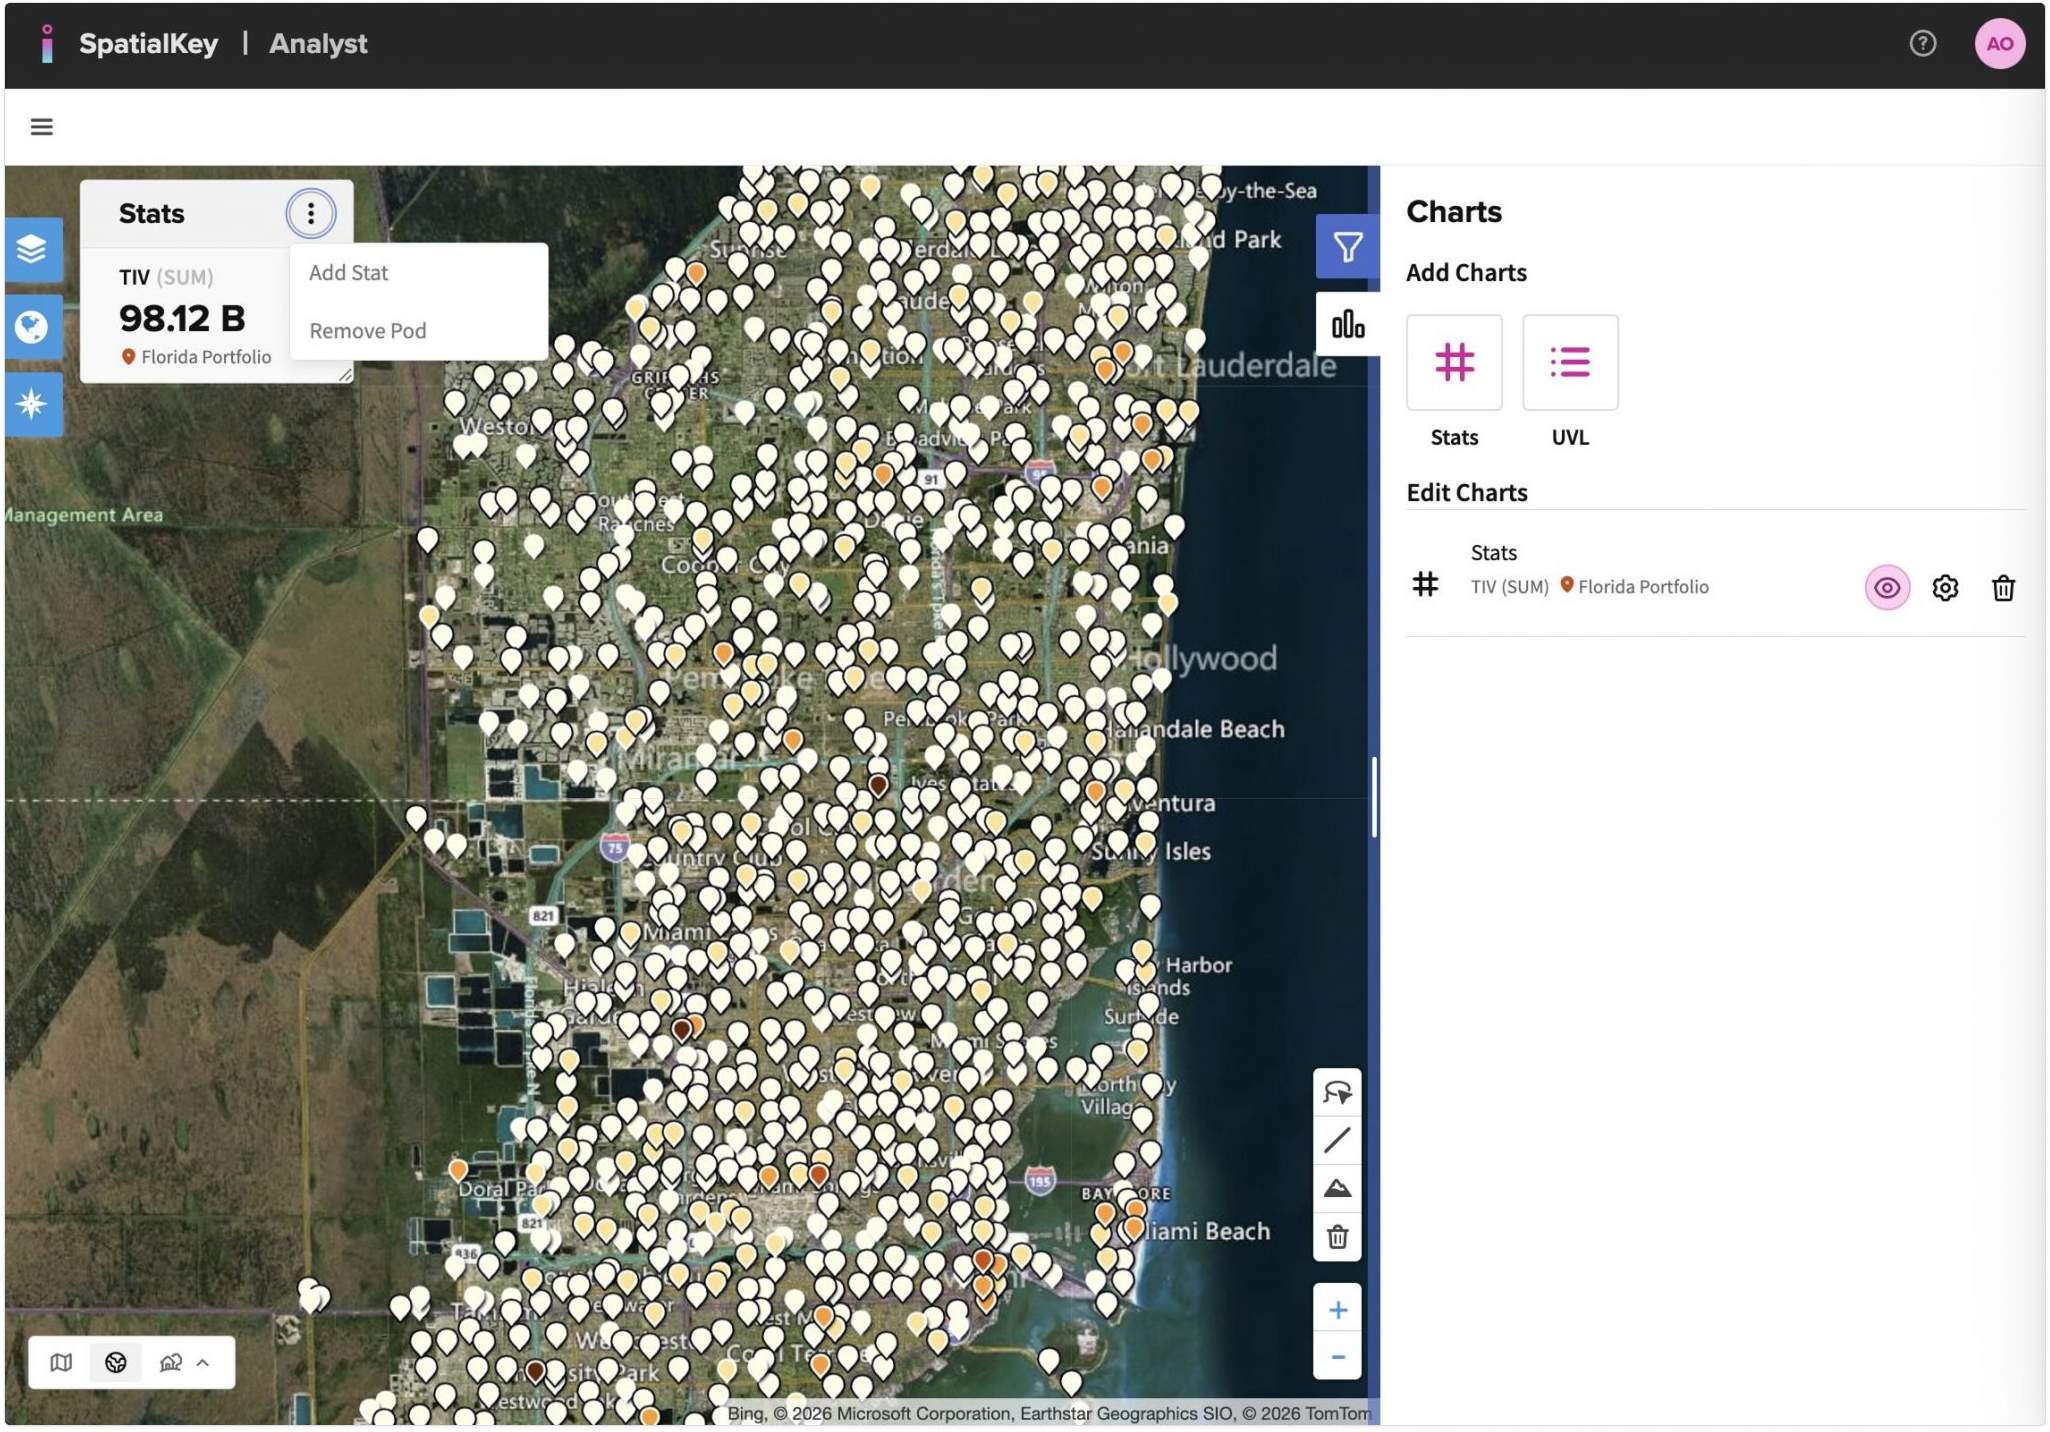
To add a stat or remove the pod, click the “…” menu in the upper right corner of the pod.

A map showing southeast Florida with clustered location markers. In the upper left, a Stats pod displaying ‘TIV (Sum)’ with a value of 98.12 B has its three‑dot ‘more’ menu open. The menu shows options to ‘Add Stat’ and ‘Remove Pod,’ allowing the user to manage the stats pod. The Charts panel on the right lists the active stats for the Florida portfolio.

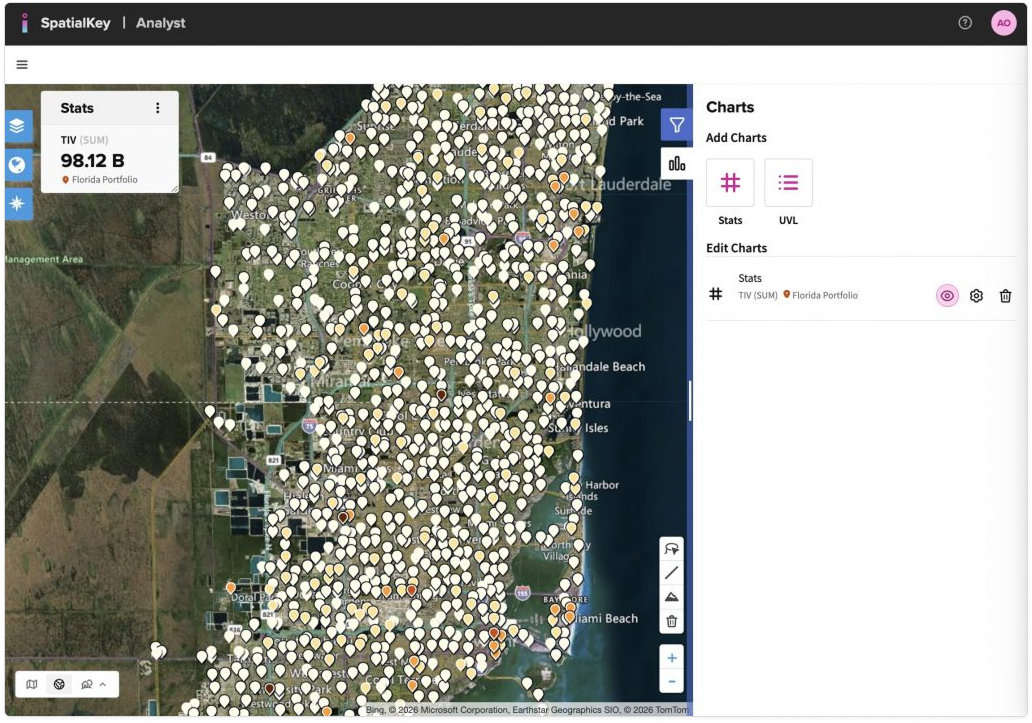
To hide, rename, or edit a Stats pod, use the controls in the Charts panel.

A map showing southeast Florida with clustered location markers. On the right, the Charts panel displays an active Stats pod for the Florida portfolio. Action icons next to the Stats entry allow the user to hide or show the pod, rename it by editing the title, or open editing options to modify the stat. The corresponding Stats pod showing total insured value appears in the upper left of the map.

Was this helpful?

Yes

No


Thanks for your feedback!

Tagged: