
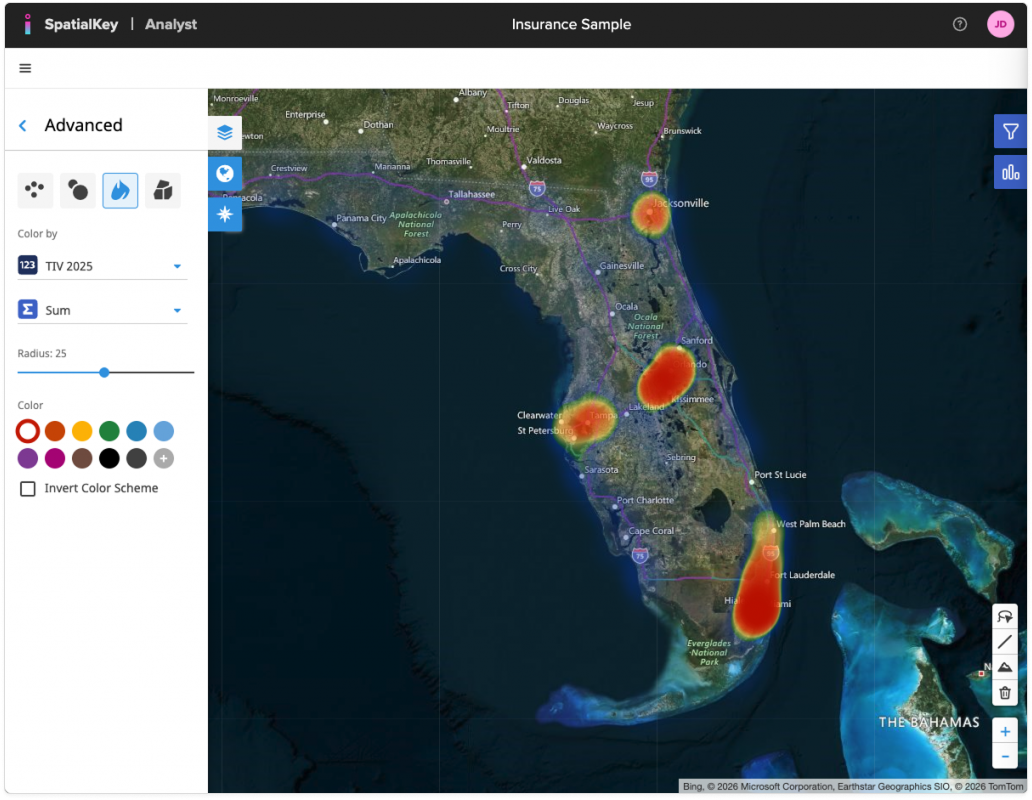
SpatialKey offers many ways to visualize your data, and color settings play a major role in how those visualizations come to life. Find the color settings by clicking “Advanced” on any layer in your dashboard.
SpatialKey uses two primary methods to color your data, depending on the type of data you import: numeric values (such as integers or decimals) or strings.
Here’s what we’ll cover:
Numeric Data
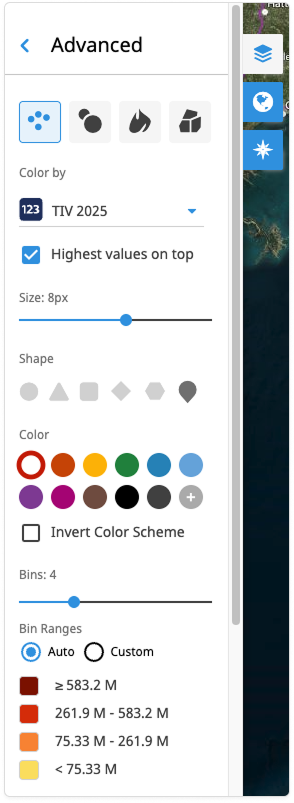
Numeric data is typically colored using binning, which groups points or shapes into value ranges (see Heatmap Gradient for the exception to this approach). Each point or shape is assigned to a color “bin” that represents its value range, helping you easily spot similarities and differences in your data across locations. SpatialKey can automatically distribute your data into 2-9 bins using a built‑in algorithm, or you can manually define the bin ranges—or even change the number of bins—to suit your needs.
Note: For point visualizations and graduated circles, you can choose to color all locations using a single color instead of multiple bins.
SpatialKey provides several preset color palette options, including several sequential and divergent palettes. You can also customize and create your own palette by clicking the last color swatch with the “+” icon. Below are the available palette options you can choose from:
| Red | Orange | Yellow | Green | Dk Blue | Blue | Purple | Magenta | Brown | Black | Gray | Custom |
|---|---|---|---|---|---|---|---|---|---|---|---|
Automatic Binning Methods
By default SpatialKey uses the Natural Breaks binning method. Natural Breaks uses an algorithm (referred to as the Jenks Optimization) to automatically determine logical breaks in your data.
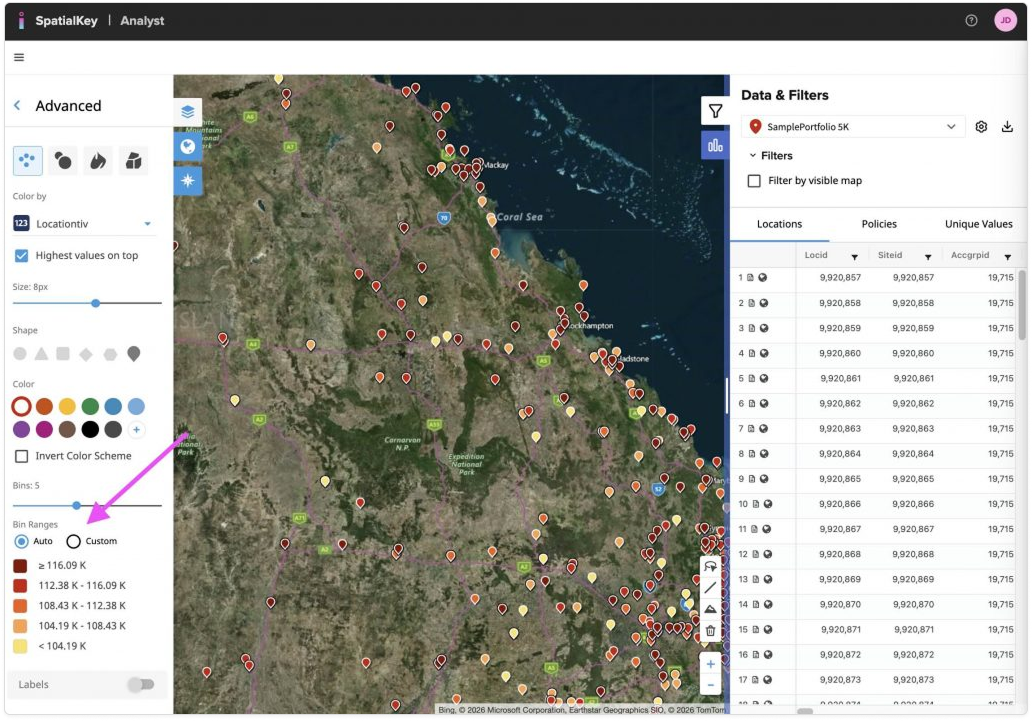
When using an automatic binning method, binning is done based on the values associated with only the points or polygons that are in the current visible extent of the map. This means as you pan or zoom the map, the color an any specific point or polygon may change as the overall set of visible locations has changed.
For example, if you were looking at a dataset of average real estate sale prices by county, the value for a specific county might be relatively low when looking at the data nationwide (and placed in a “low” bin), but relatively high when looking at just a portion of a state (and placed in a “high” bin). This dynamic binning based on the visible extent of the map is generally a huge advantage over traditional static tile maps because this allows you to make better visual comparisons of the locations you are viewing.
However, you can always “lock” the bin ranges to prevent this behavior by switching to manual binning mode.
Custom (Manual) Binning
For point visualizations, you can use Custom binning to lock the ranges that have been set using an automatic binning method so that they don’t get re-computed based on changes the range of values visible on the map. Ranges for the bins can also be overwritten manually. With Custom binning selected, the ranges for these bins won’t change as you pan and zoom the map, or change data in your filters.
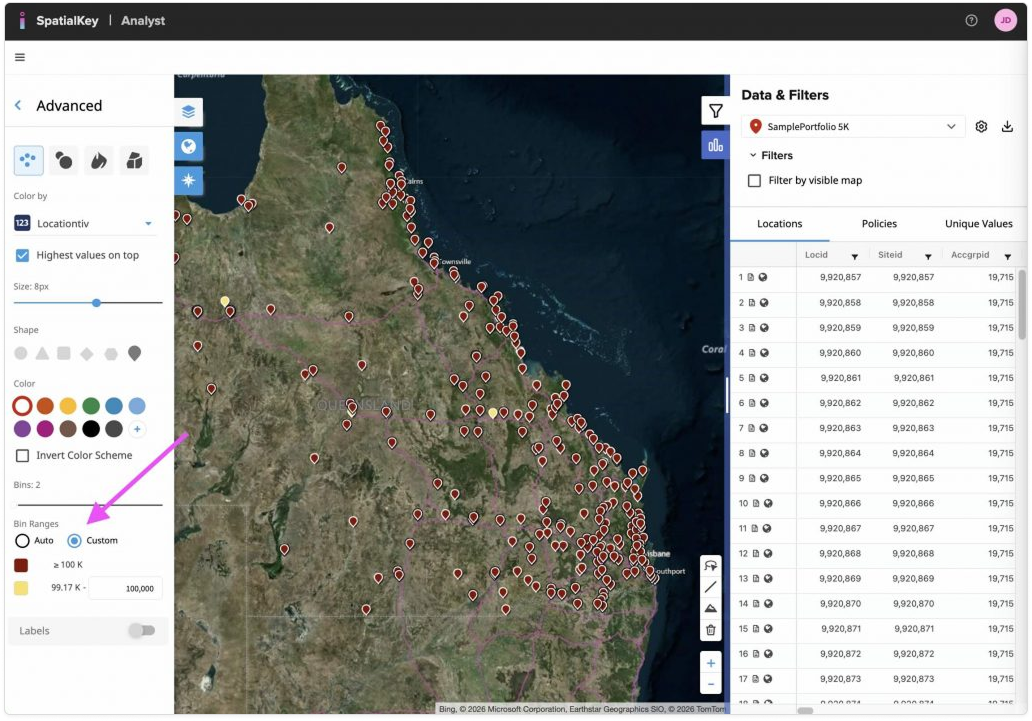
Note: Custom binning is not yet available for graduated circles or thematic visualizations.
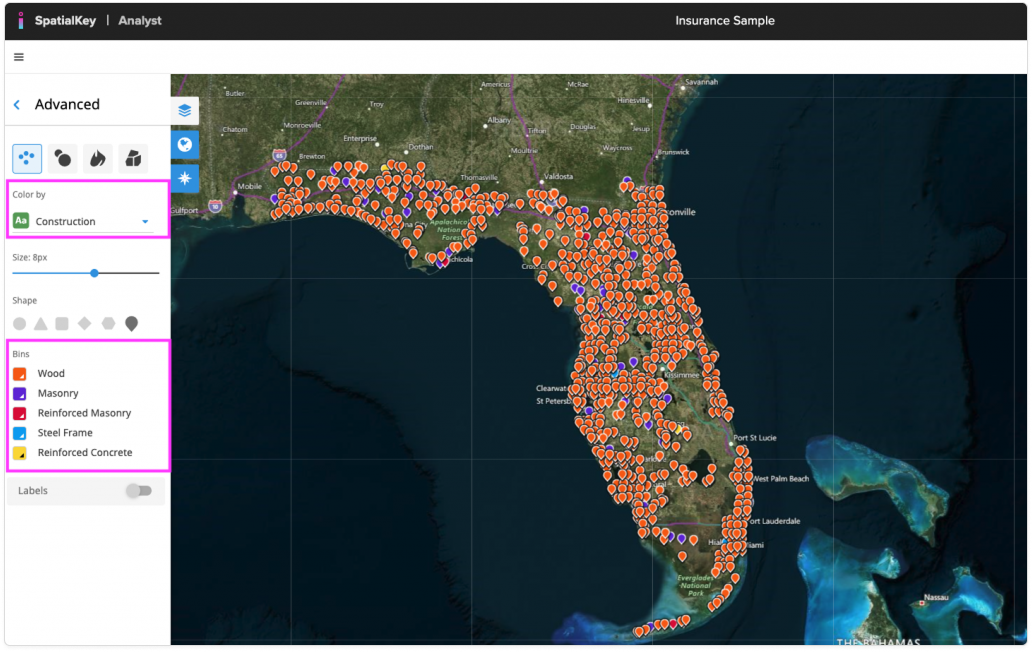
String Data
String data is colored using unique values, which group points or shapes into categories based on the selected column’s labels. Each category is assigned a distinct color, making patterns and differences across locations easy to identify. Colors are assigned automatically by SpatialKey, but you can customize them if needed.
The ability to color by string columns is limited to individual point visualizations because the other visualization types—such as heatmaps, graduated circles, and thematic boundaries—rely on aggregate or continuous ranges of data.
Heatmap Gradient
Heatmap is the only visualization type that does not use bins for numeric values. Instead, it applies a continuous gradient color palette to smoothly represent changes in values across the map.
SpatialKey provides several preset color palette options, including several sequential and divergent palettes. You can also customize and create your own palette by clicking the last color swatch with the “+” icon. Below are the available palette options you can choose from:
| Red | Orange | Yellow | Green | Dk Blue | Blue | Purple | Magenta | Brown | Black | Gray | Custom |
|---|---|---|---|---|---|---|---|---|---|---|---|
 |
 |
 |
 |
 |
 |
 |
 |
 |
 |
 |
Custom Color Picker
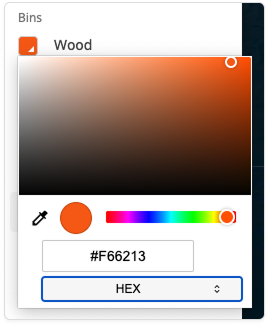
The color picker gives you several ways to choose and customize a color.
Main Color Section Area (Large Gradient Box)
- The large square gradient lets you refine the shade and brightness of the currently selected hue
- Left ↔ Right: adjusts saturation (left = more gray, right = more intense color)
- Top ↔ Bottom: adjusts lightness (top = lighter, bottom = darker)
- The small circle shows the exact point you’re selecting within the gradient
Hue Slider (Rainbow Bar)
- The rainbow bar beneath the gradient controls the hue—the base color
- Dragging the small circle left or right changes the hue (red, orange, green, blue, etc.)
- The gradient box updates dynamically based on the hue you select
Eyedropper Tool
- Clicking on the eyedropper icon allows you to pick any on‑screen color
- After clicking, you can hover anywhere on your screen and click to capture that color into the picker
Color Preview
- The circle filled with a solid color shows your currently selected color
- It updates instantly as you move sliders or click in the gradient
RGB, HSL, HEX Field
- The text box (e.g., #f66213) shows the color value in RGB, HSL or HEX format
- You can type a new value to jump directly to a specific color
- The dropdown labeled RGB, HSL or HEX lets you choose other color representations
- Changing the format converts the displayed color value to the selected format
Was this helpful?