
Do you have another dataset that could be used to enhance your existing dataset? Do you want to create thematic maps by a shapefile of your choice? Is your shapefile too complex for simple “filter my data by shape” actions in your dashboard?
… if you answered yes to any of these questions, creating data joins may be right for you!
Joining datasets together is very easy with SpatialKey and can be done if you are the Creator/Editor or Contributor of a dataset. This page will walk you through the types of joins that you can create and the various ways in which you can set them up. Once you have joins setup, you can use them in your dashboard to further enhance your analytics.
Types of joins
Joining two point datasets
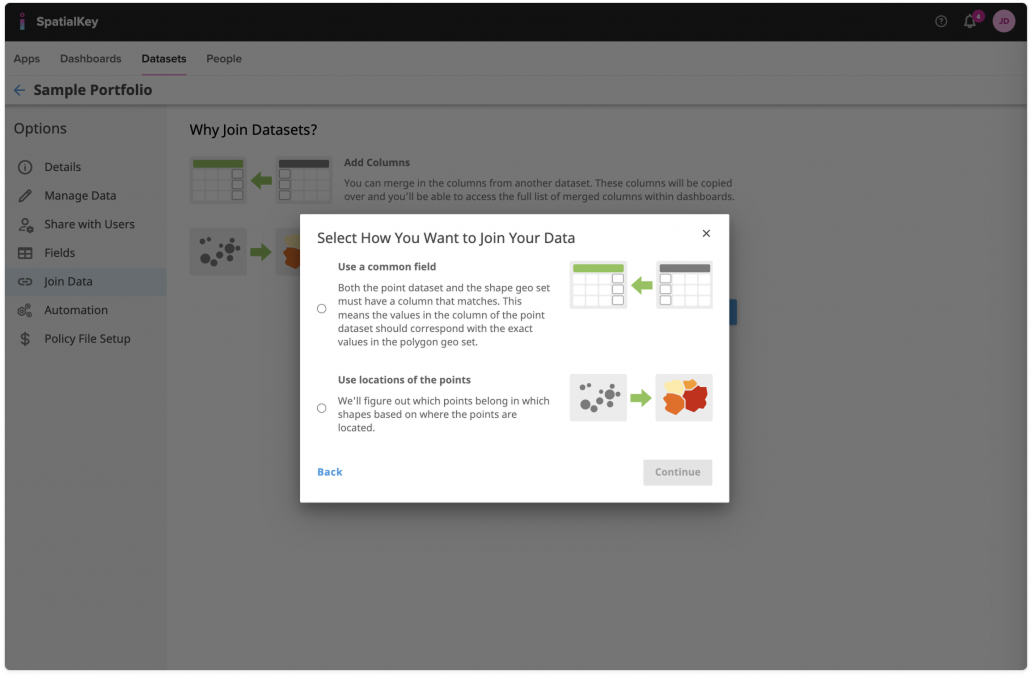
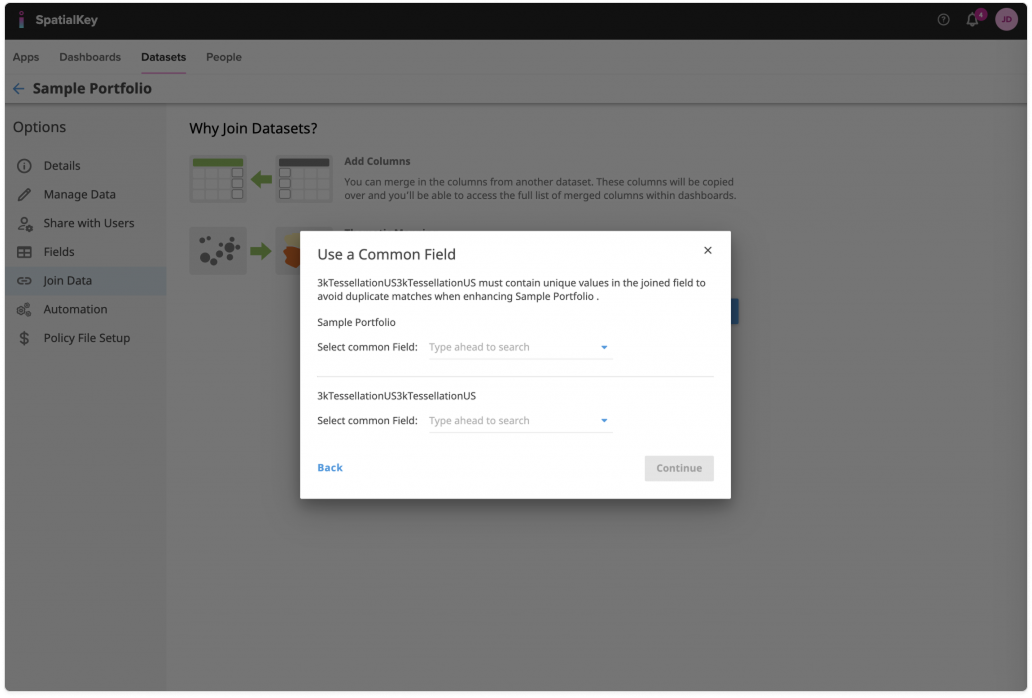
Two datasets can be joined to allow data from a secondary dataset to be displayed along with data from the first as if the secondary data was part of the primary. When joining the datasets you select a field from each dataset to be used to align and merge the datasets – these two fields must be the same data type (i.e. text, number, date). For the join to work successfully, the selected field must contain only unique values in each dataset to avoid a many-to-many join relationship. Neither dataset is permanently altered after a join is setup, but it will be possible to perform analysis using the correlated data.
Joining a point dataset with a boundary file (shapefile)
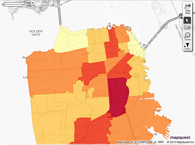
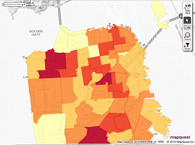
A boundary file contains boundaries like states, counties, postcodes, storm tracks, or even custom polygon shapes. Here are a few examples of boundaries.
 |
 |
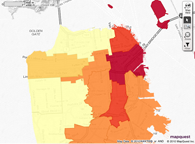 |
| Zip Codes | Police Districts | Supervisor Districts |
You can join a dataset to a boundary file using matches between point locations in the dataset and boundary file. The join will allow you to view your dataset thematically within the shapes of the boundary file. This allows you to visualize the data within the shapes of the boundary file – for example, to show the total amount of sales in each sales territory or the insured value of properties within a storm footprint.
If you are working with a line shapefile, such as roads or tornado tracks, SpatialKey supports proximity-based analysis using buffers. See Working with Line Shapefiles in SpatialKey for guidance on how to analyze locations near linear features.
Setting up the join
Through dataset settings
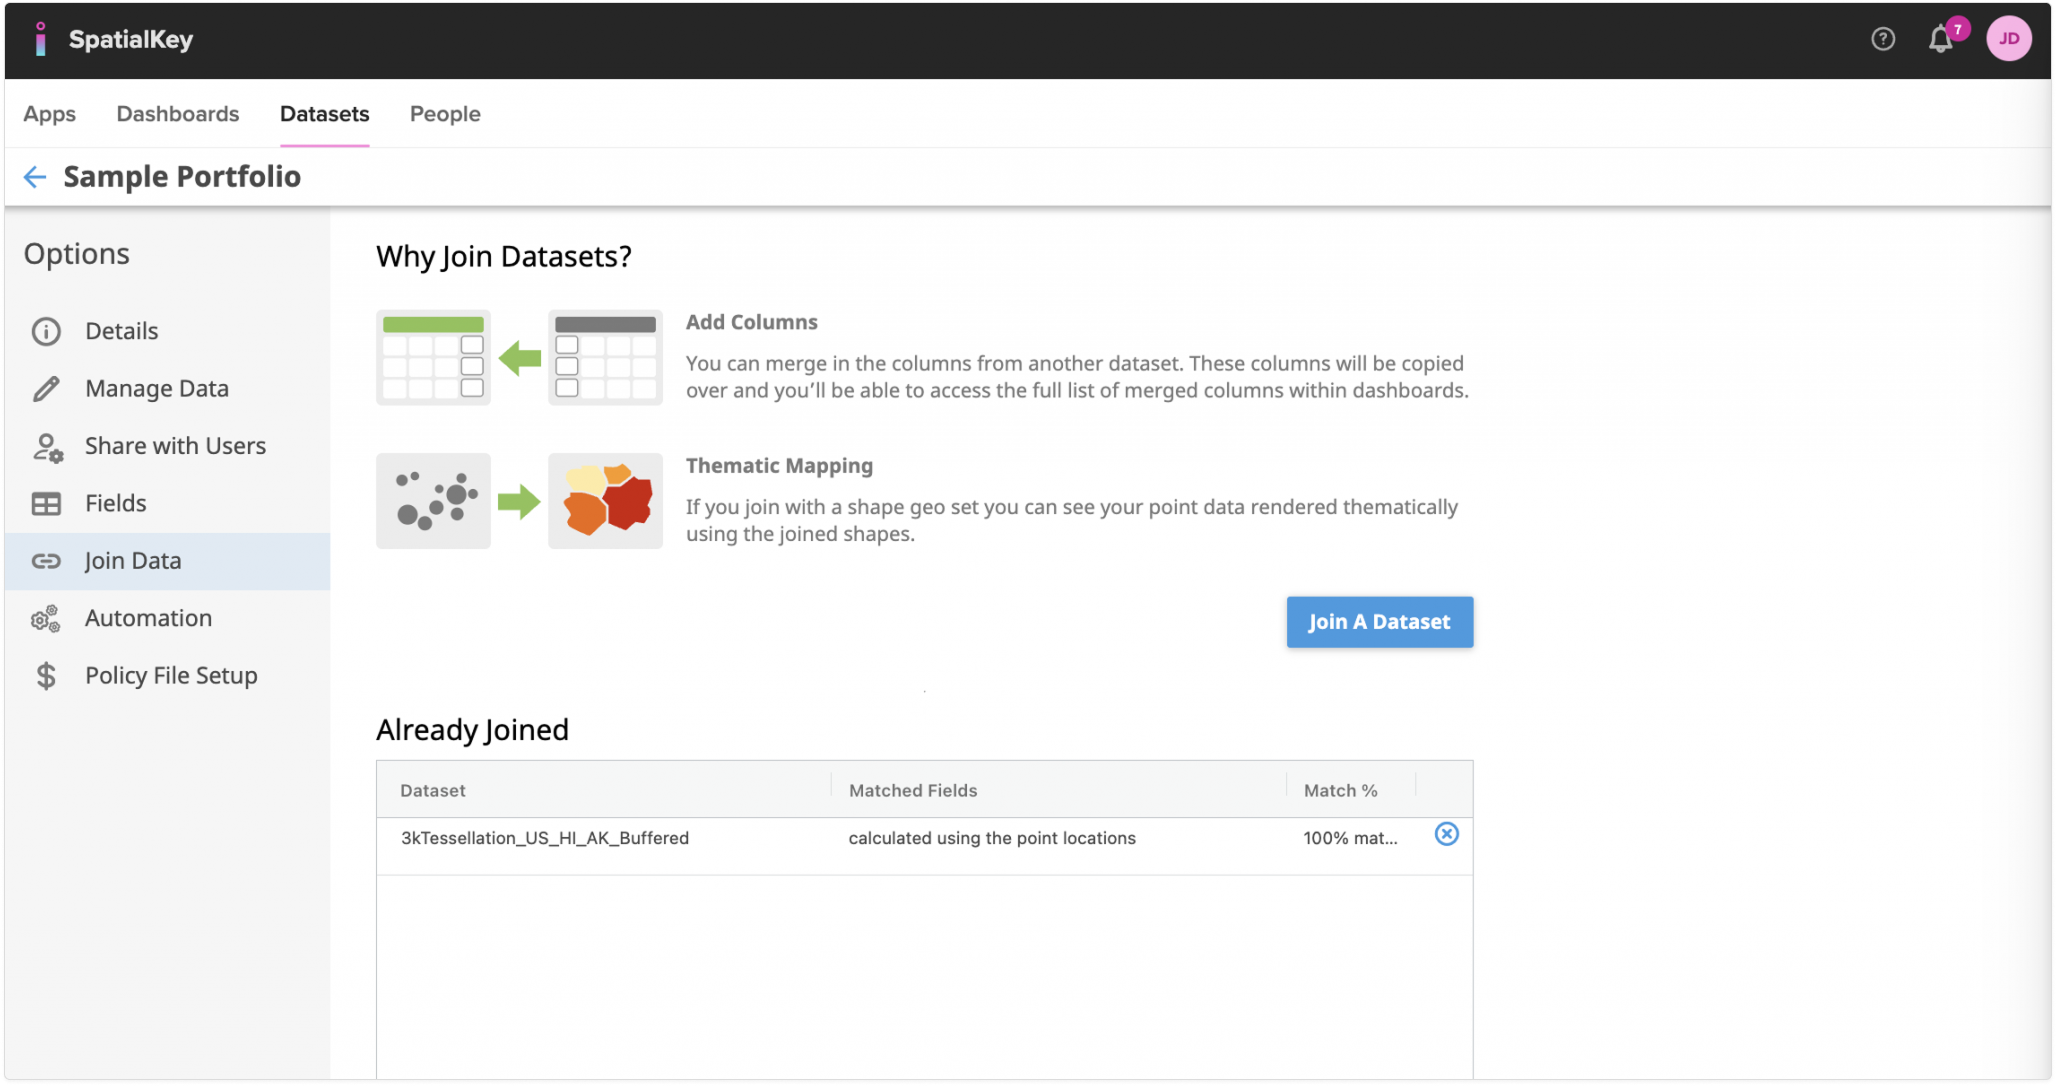
To begin, select the Datasets tab and find your dataset. Click on the gear icon to view data settings and select the “Join a Dataset” option on the left side of the screen. Note: you will only see this option if you are the Creator/Editor or Contributor of the dataset.
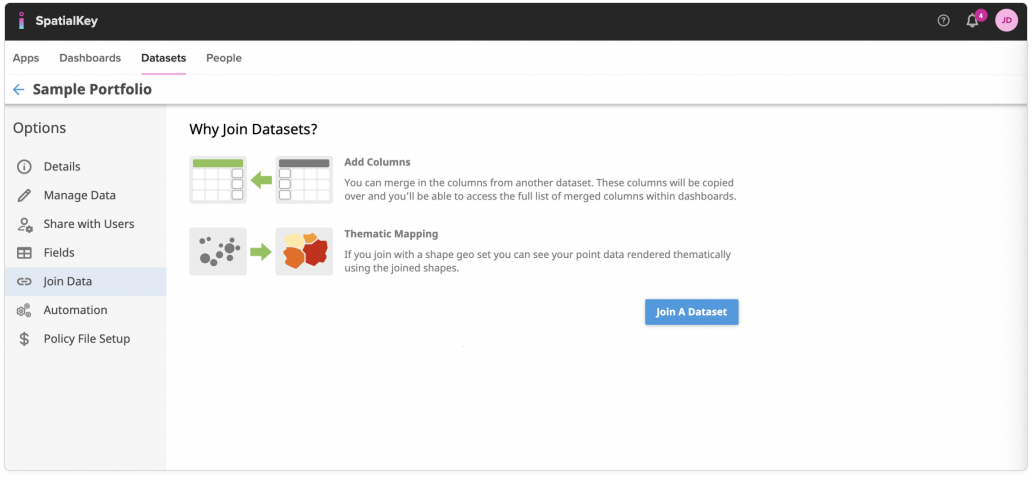
You’ll be walked through a couple of screens where you will select which data you want to join to your dataset and select how to join them together.
Once a join has been made with your dataset, it will appear in an “already joined” section of the screen.
Join Data from Within a Dashboard
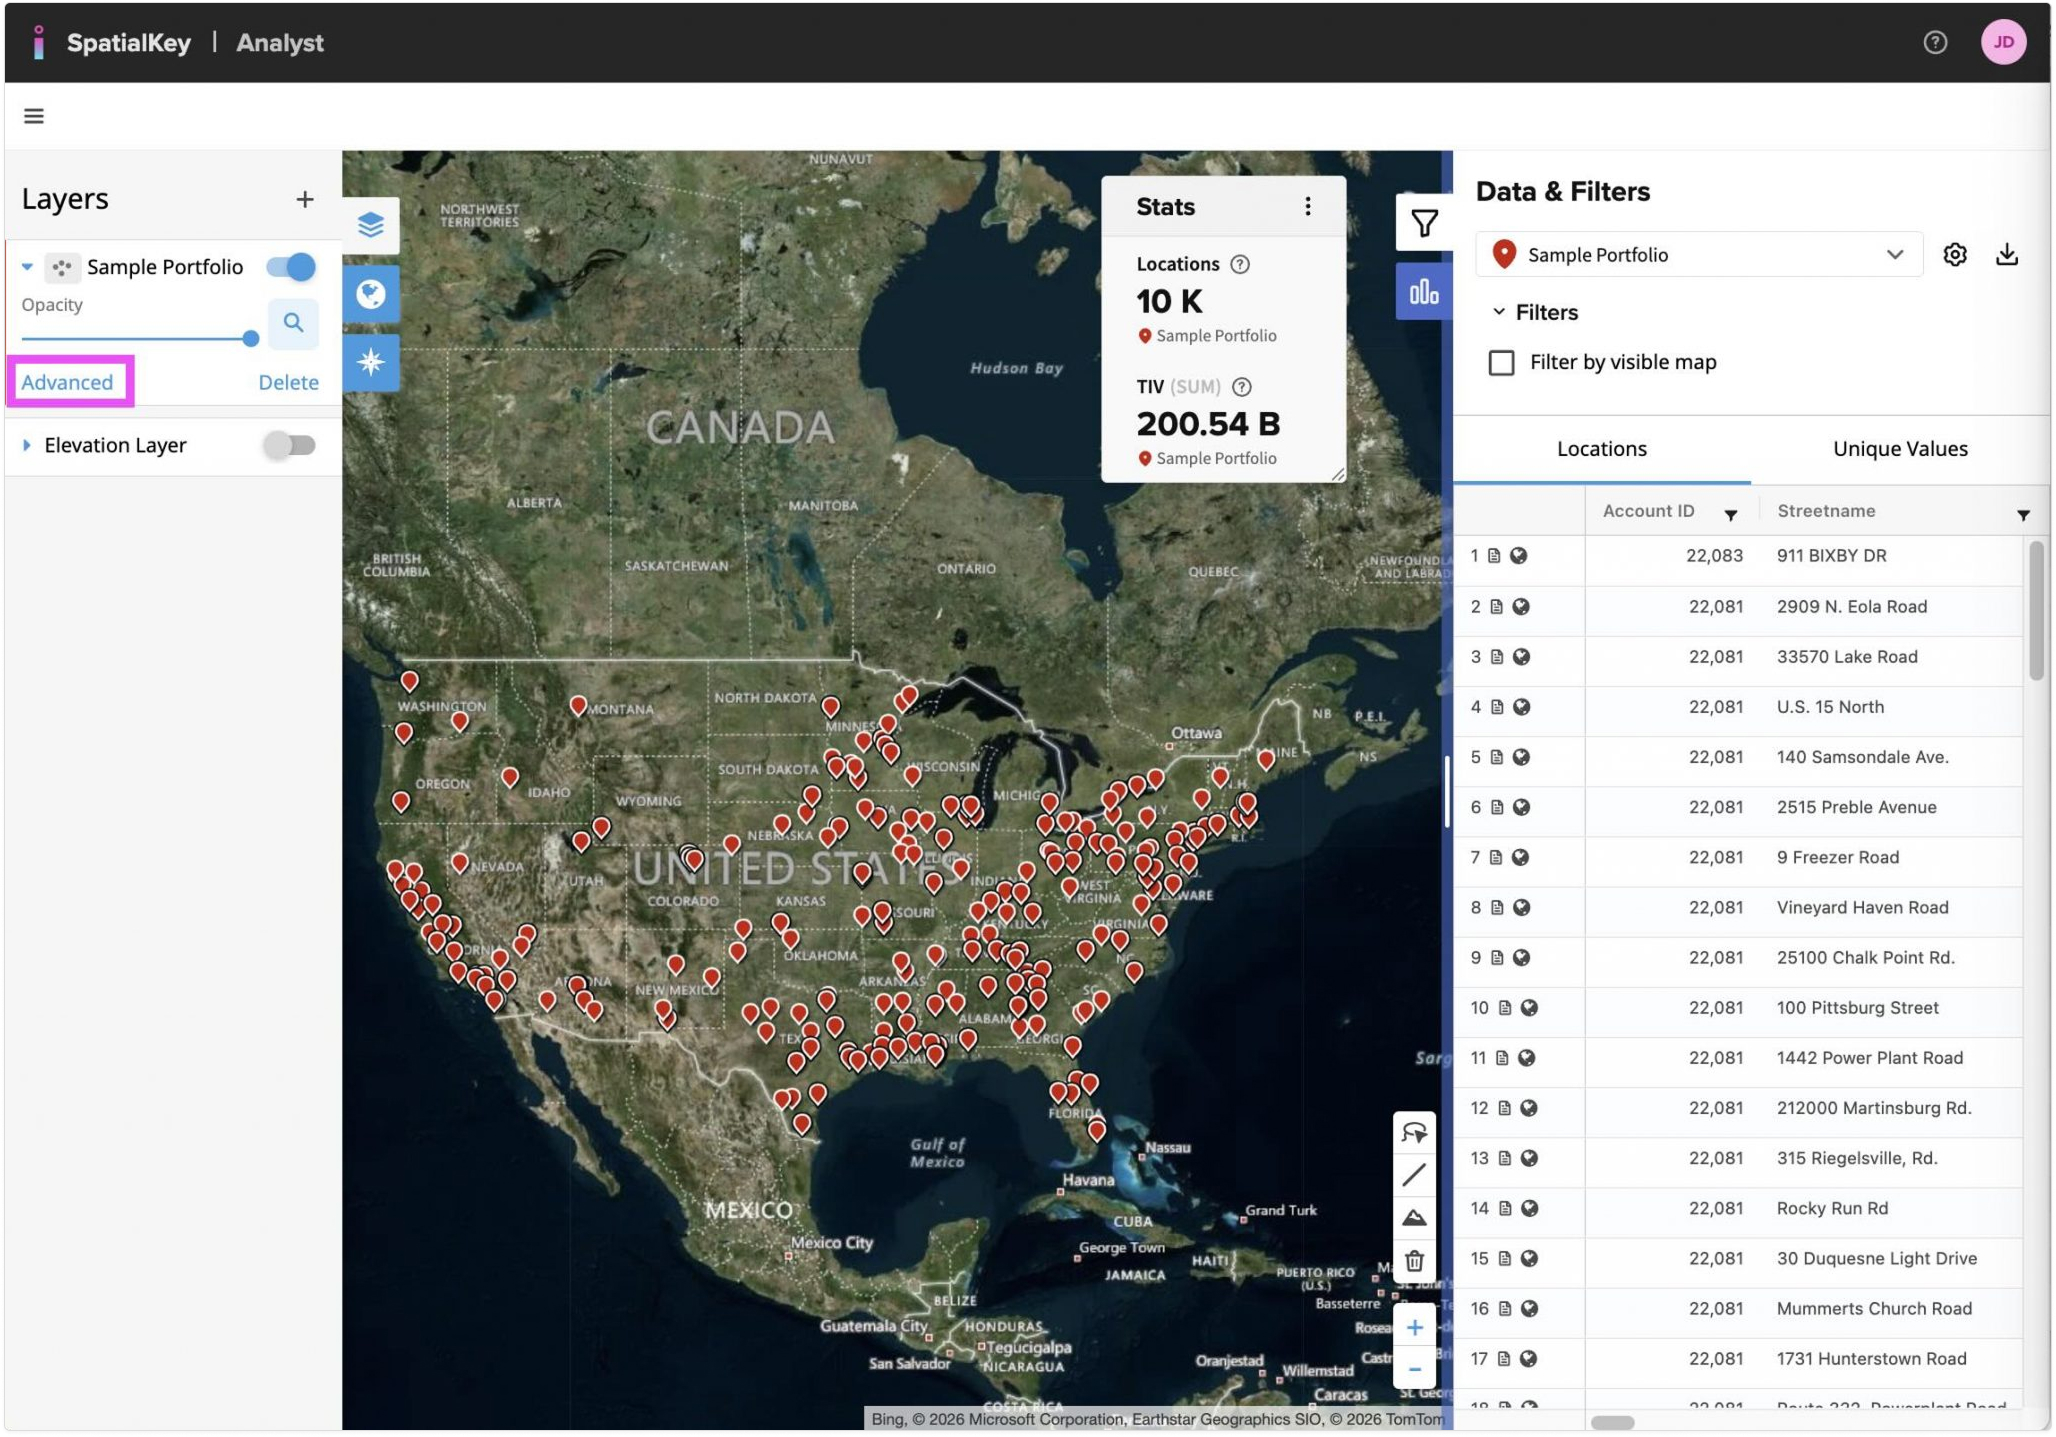
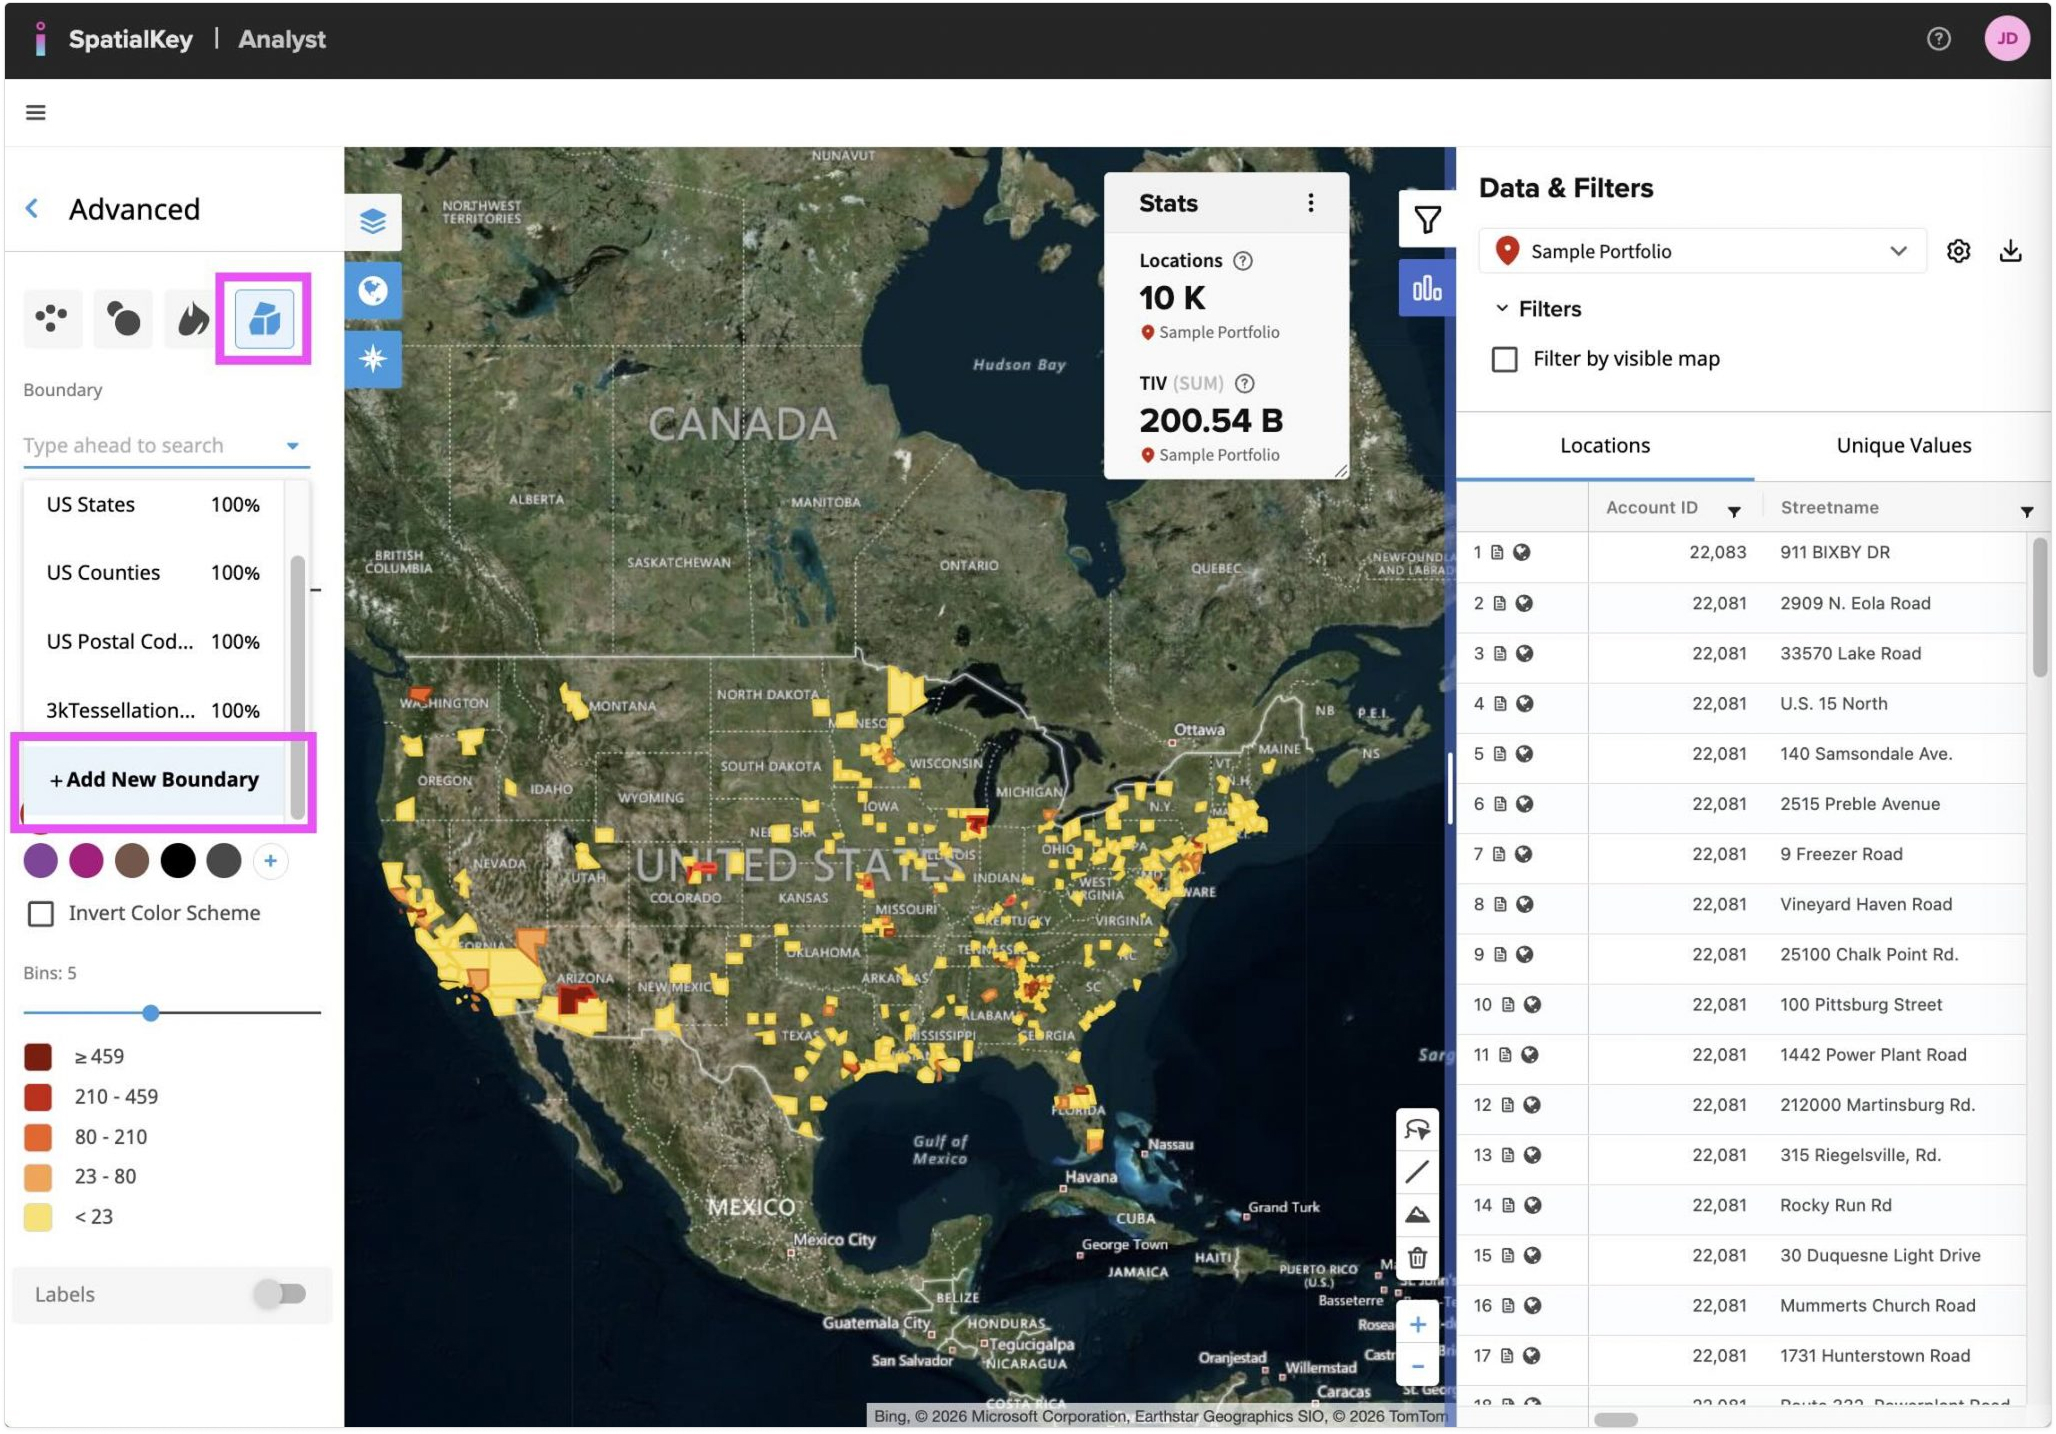
What happens if you are already working with a dataset in a dashboard and you realize that you forgot to set up your joins? Don’t worry, SpatialKey has made it easy to set up joins to a boundary file from within a Dashboard. Simply expand the Layer Manager panel on the left side of the map. Find the layer you’d like to join and click “Advanced Options”.
Next click on the “Thematic Shapes” visualization option. If you already have a shapefile joined to this dataset, SpatialKey will automatically select the first one in the list. To join another file, click the “Boundary” dropdown and select, “Add New Boundary” at the bottom of the list.
Note: you will only see this option if you are the Creator/Editor or Contributor of the dataset.
You’ll be walked through a couple of screens where you will select which data you want to join to your dataset and select how to join them together.
Using Joined Columns in Your Dashboard
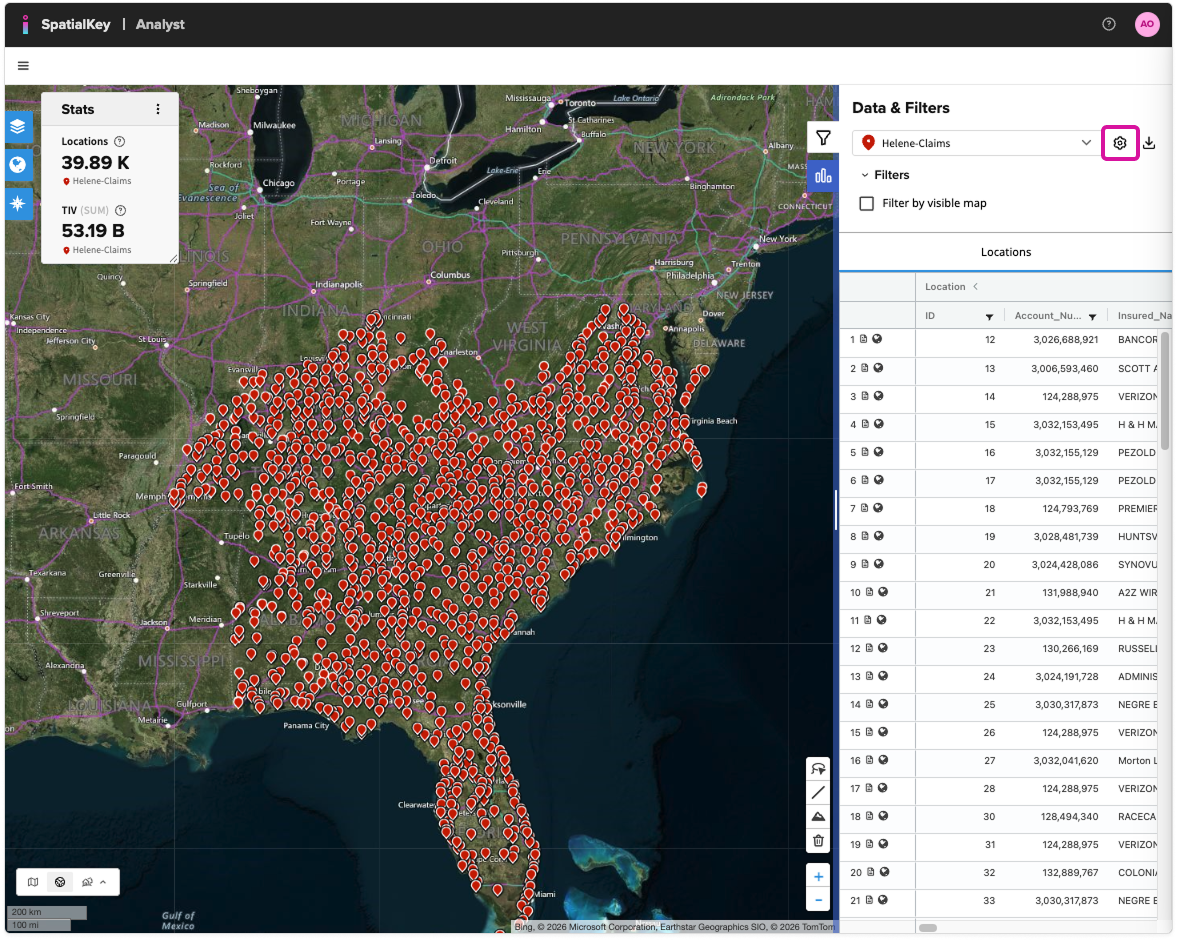
In addition to viewing your joined data thematically, you can also use joined columns in stat pods, unique value lists, and filters. By default, these joined columns are not visible in your dashboard. To make them available, open the Manage Columns modal by clicking the gear icon next to your dataset in the location panel.
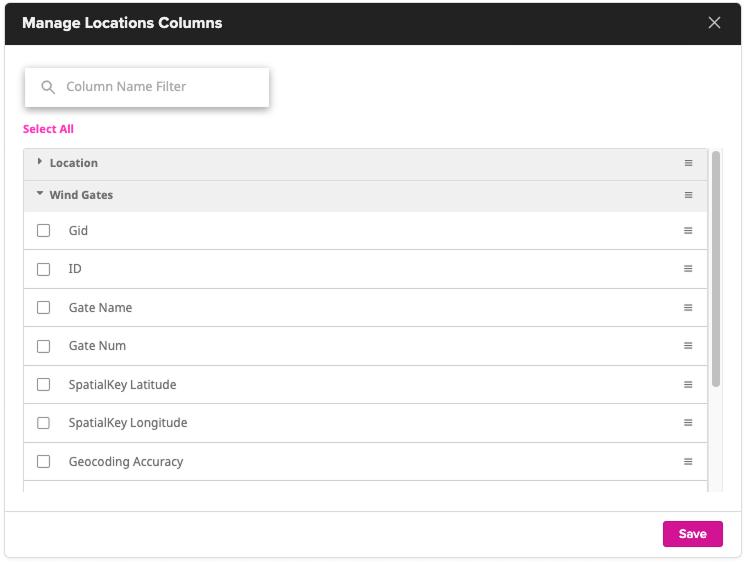
Once you open the Manage Location modal, you’ll first see the visible columns from your primary dataset listed in the Location section at the top. If you collapse that section or scroll down, you’ll find a second section containing columns from your secondary dataset—for example, the Wind Gates section shown below. Simply select the checkbox next to each column you want to use, and it will become available for stats, unique value lists (UVLs), and filtering.
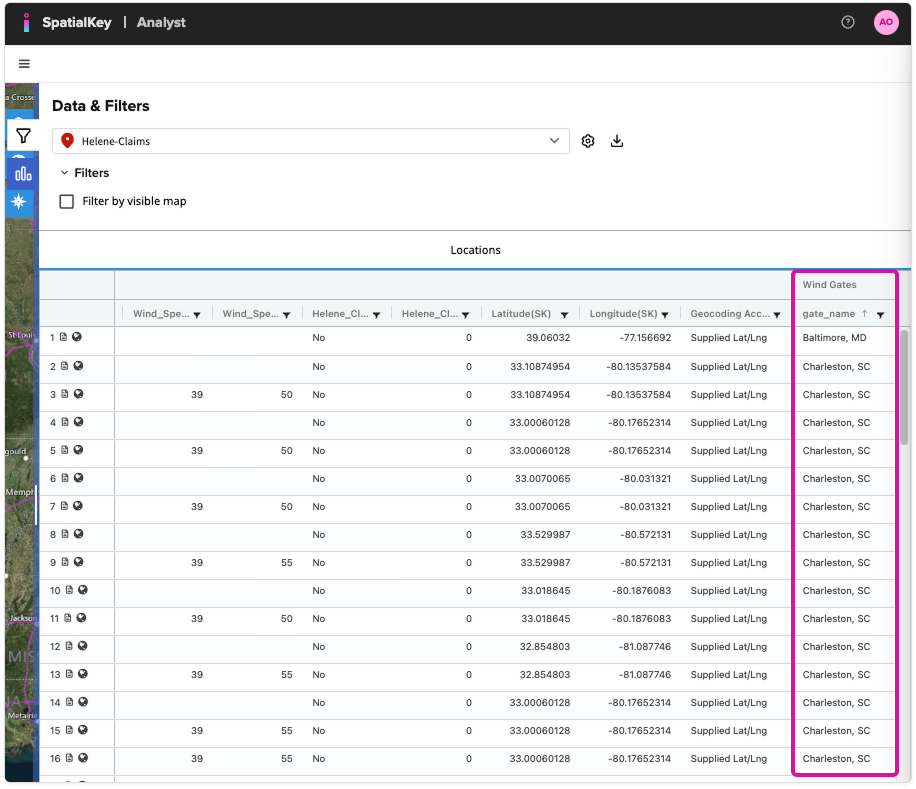
Once a joined column is visible, you can find it at the end of the location columns in the location list view, as well as in any workflow where you can select a column to use in your dashboard.
Was this helpful?