
Have you ever wanted to map your in-force portfolio, customer data or customer leads from your excel spreadsheets? This can be a challenging task; and with most solutions, you are limited by the number of points you can place on a map. What if the process from spreadsheet to map only took a matter of minutes and allowed you to share this data out to others? This is possible with Insurity Geospatial! It not only lets you see you data on a map – you can also build compelling interactive dashboards and identify trends within your data.
This article will explain the process of taking a Microsoft Excel spreadsheet or a CSV file with address information and walk you through the process of getting data into Insurity Geospatial.
Sample data
We will start with a file containing real estate sales data from Sacramento, California as reported by the Sacramento Bee. This file contains the address, city, ZIP code, state, number of bed, baths, square footage, type, sale date and price for 985 real estate transactions in the Sacramento area as reported over a 5-day period. This file contains address level information that you can choose to geocode during the process, or you can use the existing latitude and longitude coordinates in the file.
You can download this data (download .csv file) if you want to follow along.
Formatting Your Dataset
First, we need to get our data into CSV (comma-separated values) format if it isn’t already. The Sample Real Estate data is already in CSV format so we are all set; but if you are using your own data, here are some steps you can follow.
Is your data in a database? Refer to this article on Exporting Data From Database to CSV File for tips on converting your data into CSV format.
Is your data in MS Excel? You will need to export the data from Excel by saving the file as a CSV. Make sure you have cleaned up your data before exporting:
- The first row should include column header names
- Make sure there are no extra columns or characters outside of the ones you want to export
- Delete any columns you will not be using
To export your data from Excel, go to File → Save As and choose the “Format” to be a CSV file.
After saving, we are ready to jump into Insurity Geospatial and import our data.
Importing Your Data
On the Datasets tab, click on the “Add New Dataset” button and select the “Upload Dataset” option.

The first screen contains links describing what files types are supported for upload and also displays your organization’s limits, so you know how many records and columns are allowed for each dataset. Drag your file into the window or select a file from a folder to upload a dataset.

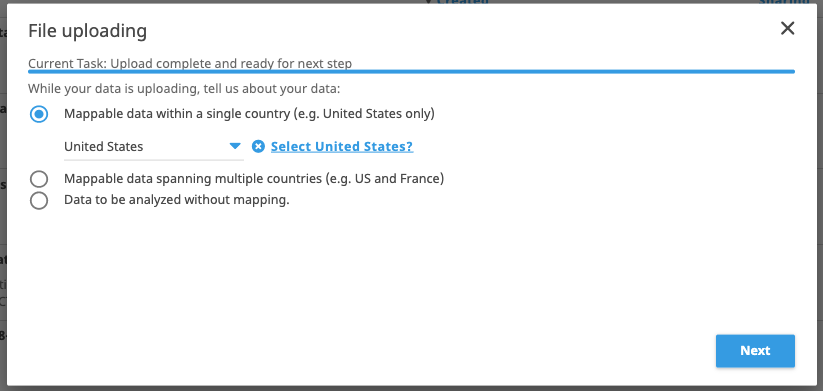
Once you select your dataset for import, Insurity Geospatial will do an initial upload of the file so we can read from the columns in future steps. While the file is uploading, you are asked to identify whether your dataset is mappable within a single country or multiple, or whether it isn’t mappable at all. Since our sample file contains records in Sacramento, CA, we will select that we have mappable data within the United States.
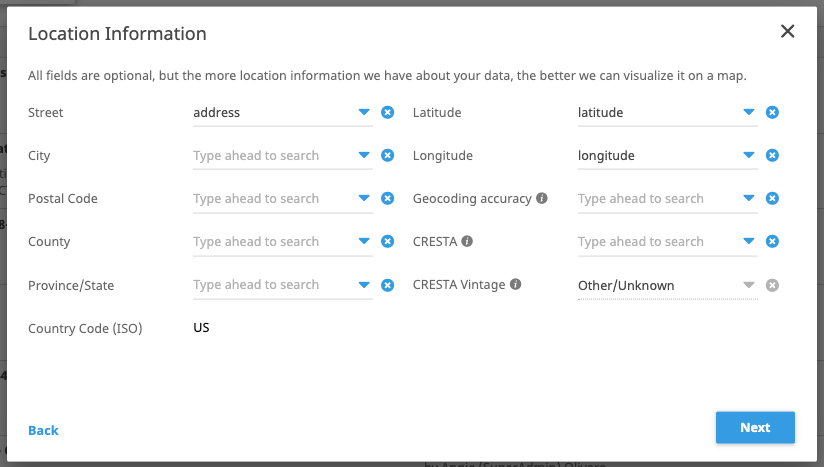
The next screen maps all your location data. Insurity Geospatial will auto-detect most fields but check them over to make sure everything looks accurate. The more location information we have about your data, the better we can visualize it on a map.
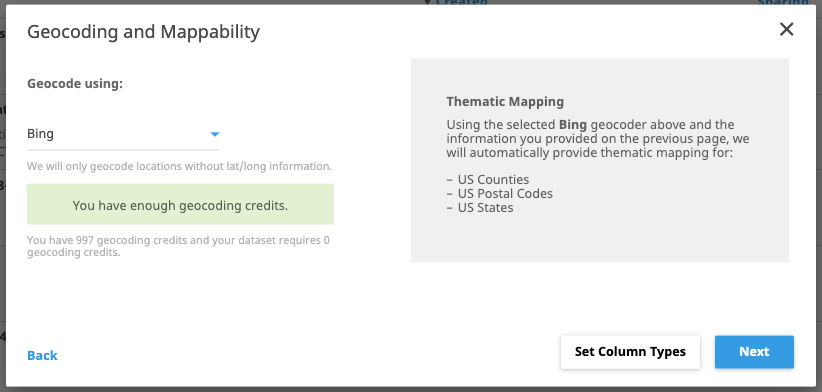
On the geocoding screen you’ll see which geocoder is licensed for your organization and a confirmation as to whether you have enough geocoding credits. If your data is in the US, we’ll automatically provide thematic mapping for US Counties, Postal Codes and US States. With this information, we will be able to create thematic maps that show the distribution of a single metric by either state, county or postal code. For more information and an example, check out this article on Thematic Mapping.
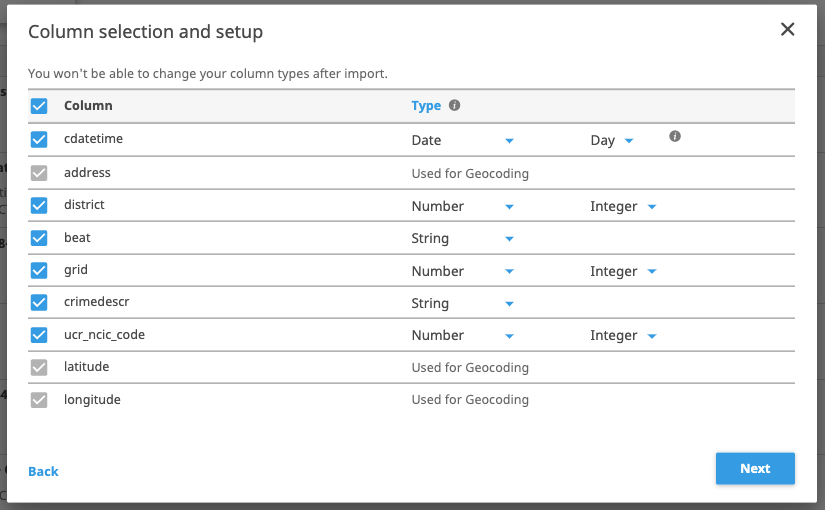
If you click the button to “Set Column Types” you’ll see how each field was detected. Most of your data will fall into one of three data types: String, Number or Date. Take the time to look over each column, what you choose here can have implications when viewing your data in a dashboard (e.g. you can only sum Numeric fields). Data type adjustments cannot be made after your data has been imported into Insurity Geospatial.
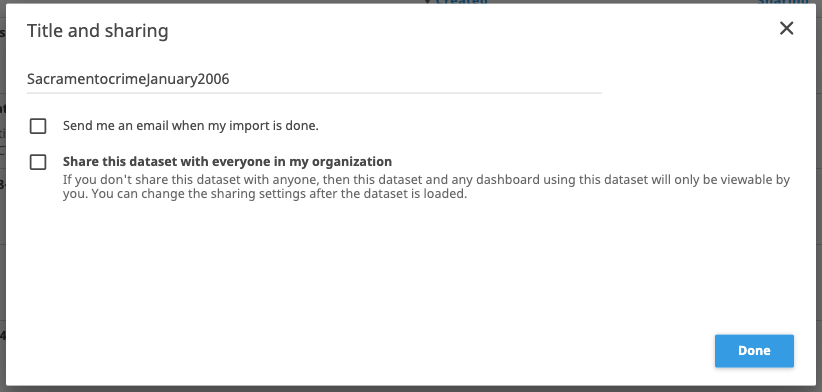
The final step is to name your dataset, request an email notification when the import completes, and opt to share this dataset with everyone in your organization. Part of the power of Insurity Geospatial is being able to easily share and collaborate with others in your organization. You are given the option to share this dataset with others; but don’t worry too much about your choice for now, you can manage permissions for datasets later.
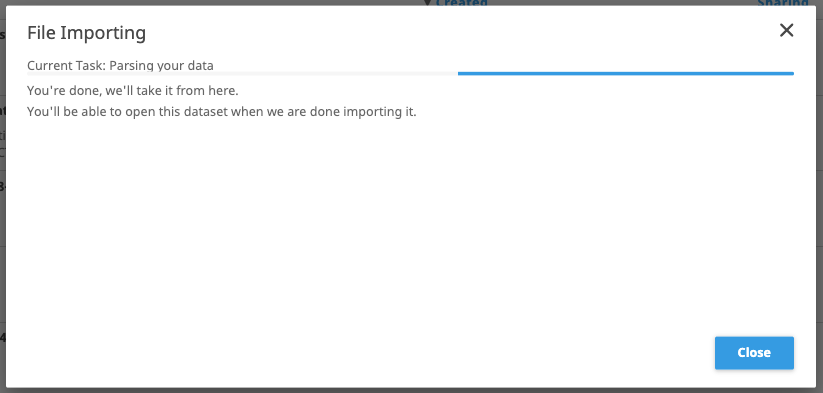
You are done setting up your first import job! You can close this screen and continue working in Insurity Geospatial until the upload finishes.
That’s all there is to getting data into Insurity Geospatial, a simple step by step process. The real fun begins when you Open Your First Dashboard.