
| Note: This feature is available in SpatialKey Client for Windows applications, i.e., Map Analyst, Hazard Analyst and Accumulations. |
The layer manager allows us to control what layers are visible in the dashboard and how those layers are visualized. In this article, we will start by walking through the layer manager basics.
Show, Hide, Minimize, Maximize
To show or hide the layer manager entirely, click the layers icon on the top left of the dashboard.
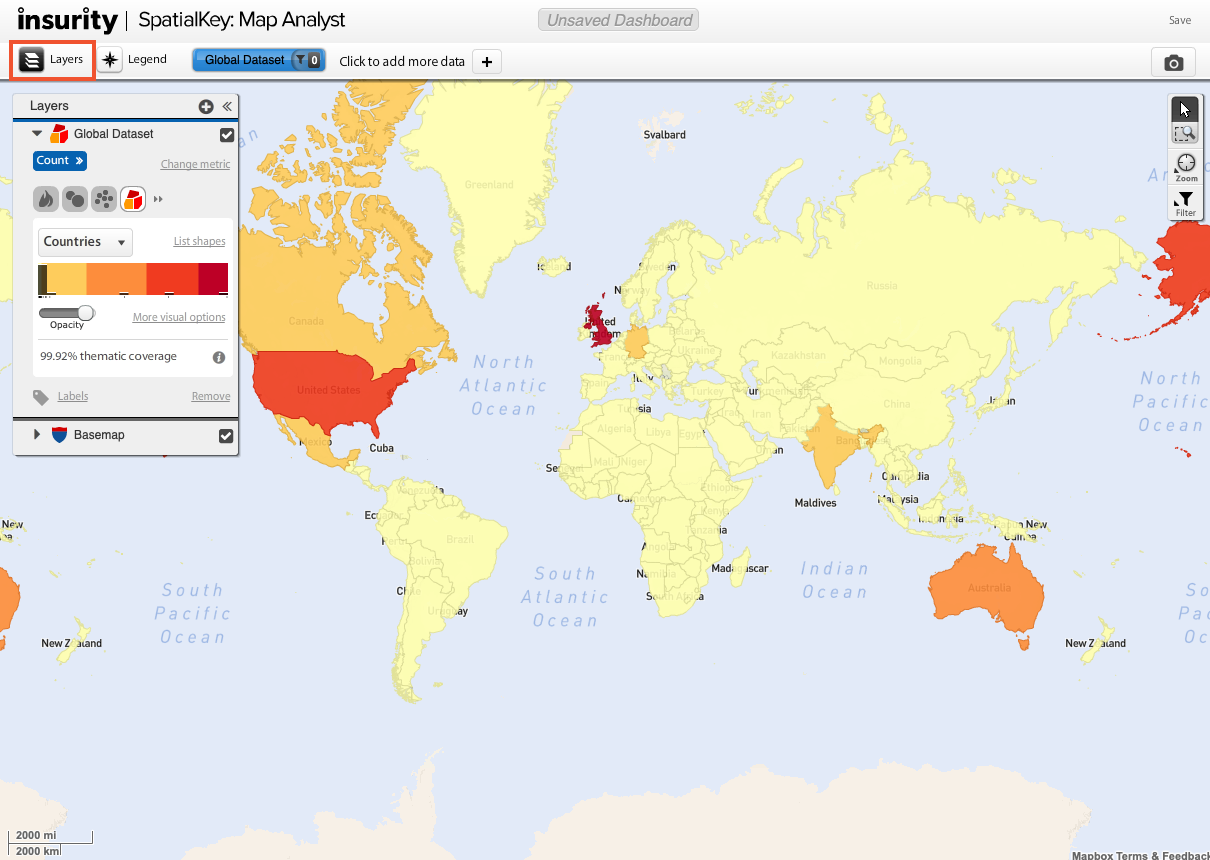
To minimize the layer manager to show just the basic options, click the arrows at the top right of the layer manager. Maximize by clicking on the double arrows again.

To expose the basic settings for individual layers, click the single arrow to the left of each layer name to either expand or collapse the layer.

Basic Settings
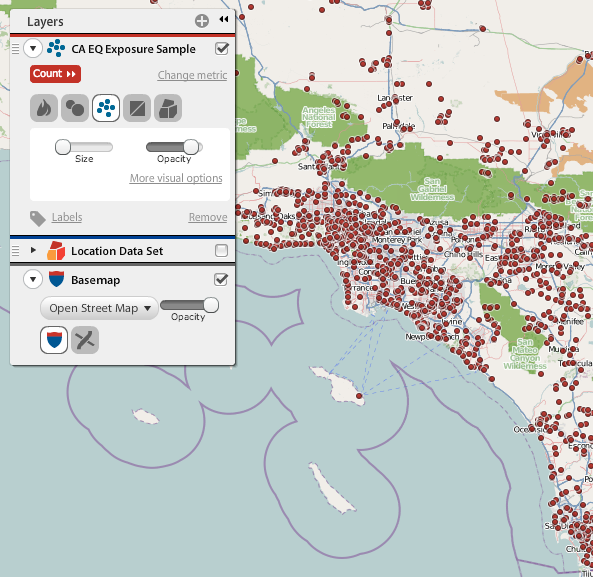
The checkboxes for each layer allow us to control the visibility on the map. The icon indicates how that data is being presented on the map. In the image below, the first layer is a point map, the second layer is a heat map, and the basemap is a black/white street map.

Expand the layers to view more settings.

The value for the layer indicates what value is being mapped. In the image above, the value for both layers is “count”  , which means that no value is being mapped and just the dark red color of the dataset is being displayed. To change the value being displayed, click on the value and some advanced options will appear. In the example below, we have selected to show TIV on the top layer, and in the case of point location overlaps, the TIV from the multiple overlapping points will show the highest value.

Another analytical dimension has now been added – the resulting map is no longer just showing us point locations, it is also communicating the points where the TIV is the greatest.

You can also switch how each layer is visualized on the map. Select from heat map  , graduated circles
  , point map
  , bivariate grid
  , and thematic map
  . Notice that the layer options change based on the selected visualization.

The opacity  of each layer can be changed to help make underlying layers more visible or to draw attention to or away from a layer. Look at how different these maps look when the opacity is adjusted for the different layers.


Reordering Layers
The order in which individual items appear in the layer manager mimics the order in which the data layers are stacked on the map. The stack order impacts visibility as well as the interactions of the mouse when you click on different areas of the map. The basemap layer is always at the bottom, meaning that all additional layers are stacked on top of the basemap. In the image below, we have a thematic layer on top of the basemap, and then a point layer on top of a thematic layer.
Layers can be reordered by dragging them above or below each other within the layers panel.

Base Map Configuration
Think of the basemap as the canvas onto which you will overlay additional data. Switch map providers within the layer manager – a couple examples are shown below for Open Street Map and MapQuest. The basemap options available depend on which map provider is selected. For example, with Open Street Map we can choose from colored and black/white street maps. With MapQuest we have the additional basemap options of satellite imagery and hybrid (satellite imagery with street maps).
Here is a list of all supported basemaps for your reference.
We can also adjust the opacity and color of the basemap. The most optimal basemap options will depend on what type of data you plan to display on the map. For example, when you visualize your data with a heatmap, you could use black/white maps with less opacity to let the data speak for itself without distraction.
