| Note: This feature is available in SpatialKey Client for Windows applications, i.e., Map Analyst, Hazard Analyst and Accumulations. |
One of the many ways to filter your data is to filter based on a joined field. Maybe you joined two point datasets together to enhance them with each other’s fields; or maybe you joined your point dataset with a shapefile in order to see which of your points fall within the shape boundaries. Whatever the reason for the join, let’s learn how to filter your data based on the joined fields.
Use Case 1
I have a point dataset that contains a list of all available homes in the Sacramento area from a few months ago. I recently received a report of homes that were sold in the area. I want to enhance my list of available homes in Sacramento so I can filter out those that have already sold.
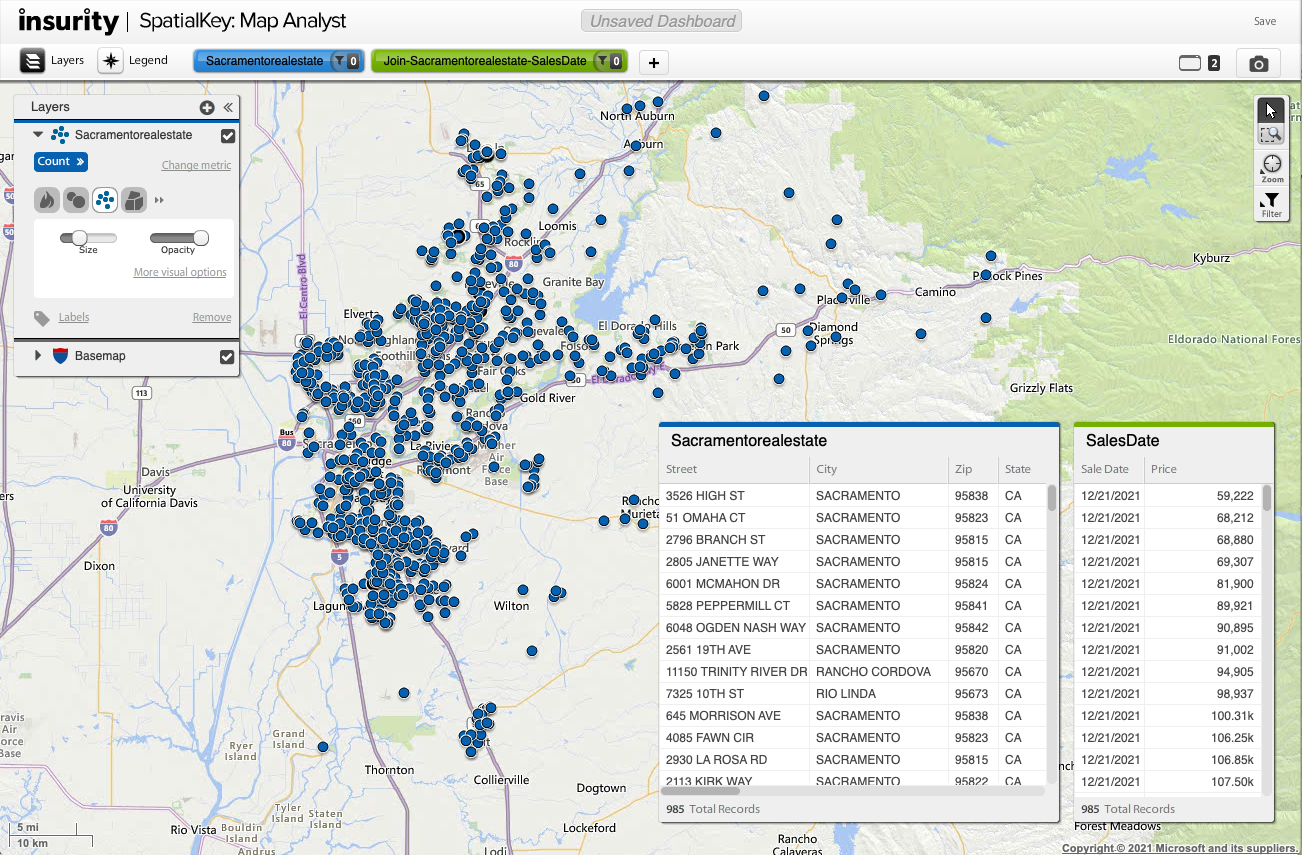
First, I need to join my two point datasets. To set up this join, go to the Manage Data settings for the available homes dataset. For more detail, check out this article on Dataset Joins.
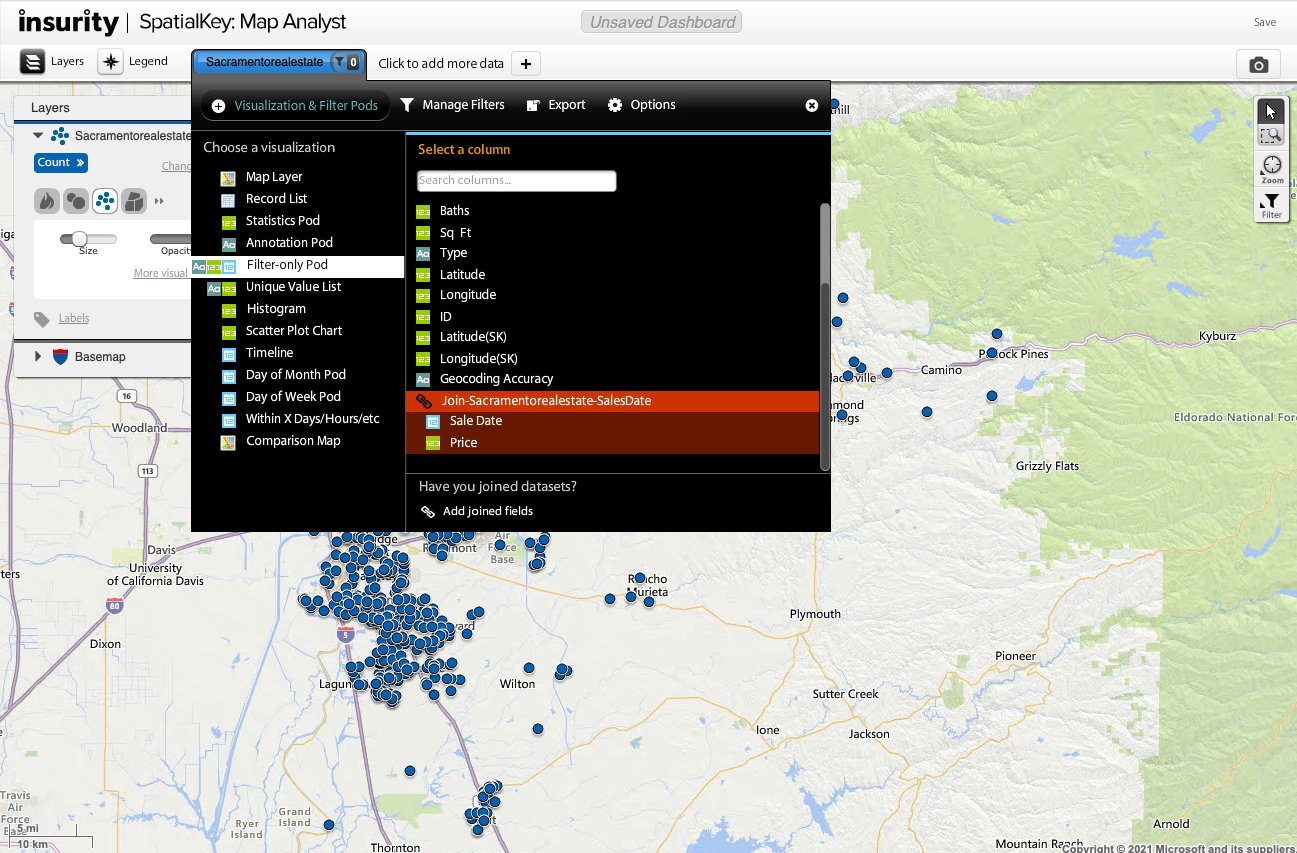
Now that the join has been set up, I can leverage the joined fields in my dashboard. Expand the Dataset Configuration Panel, select your visualization and “add fields from joined datasets”.
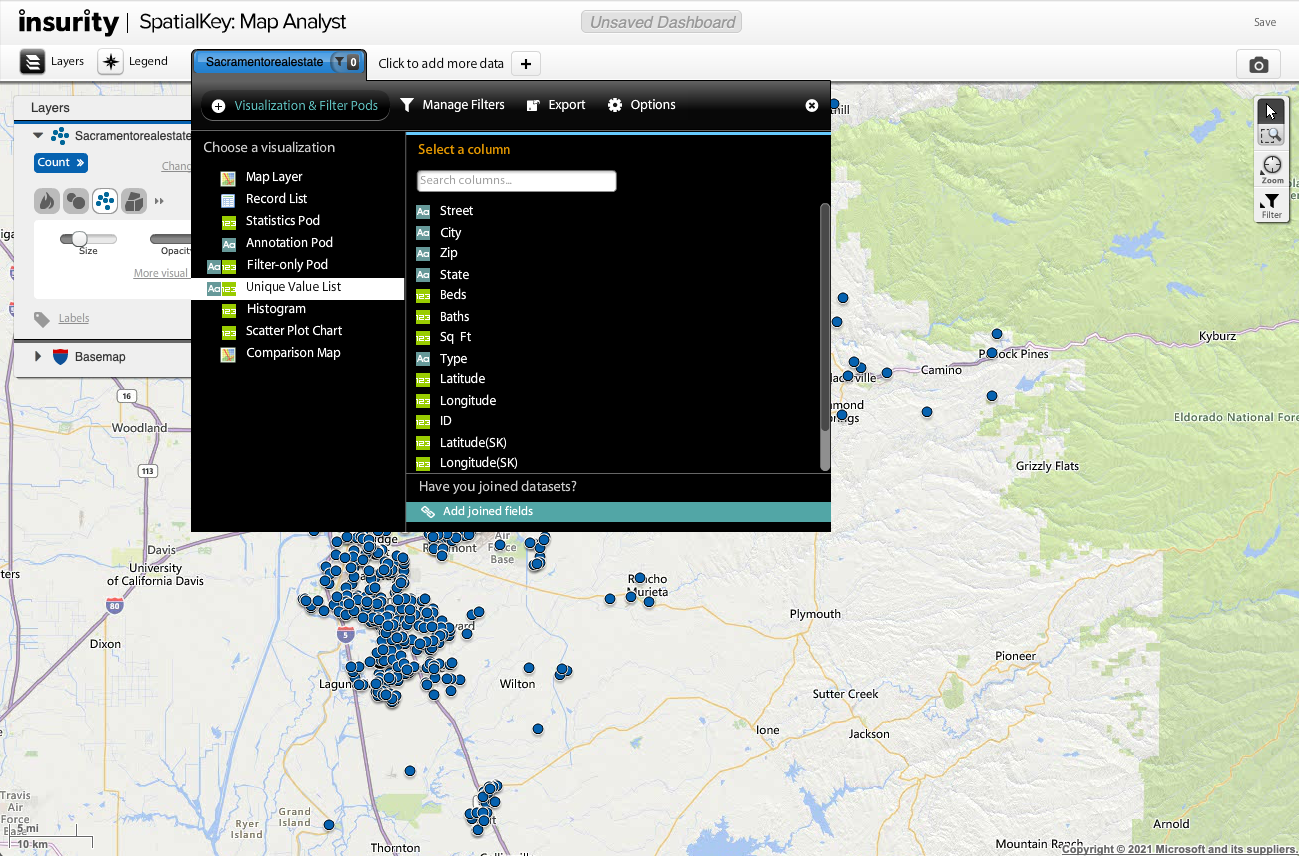
Select which fields from the joined datasets you want to use in your dashboard.
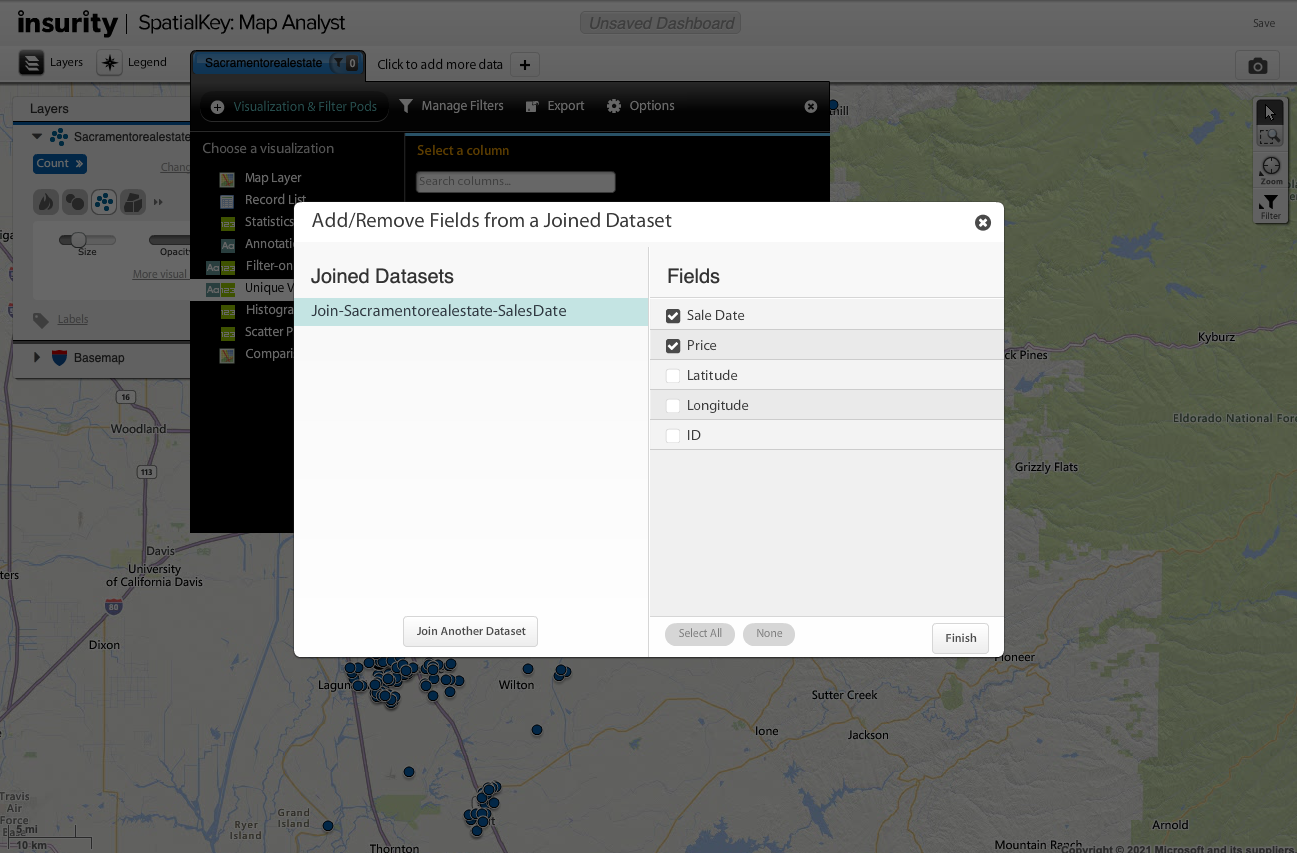
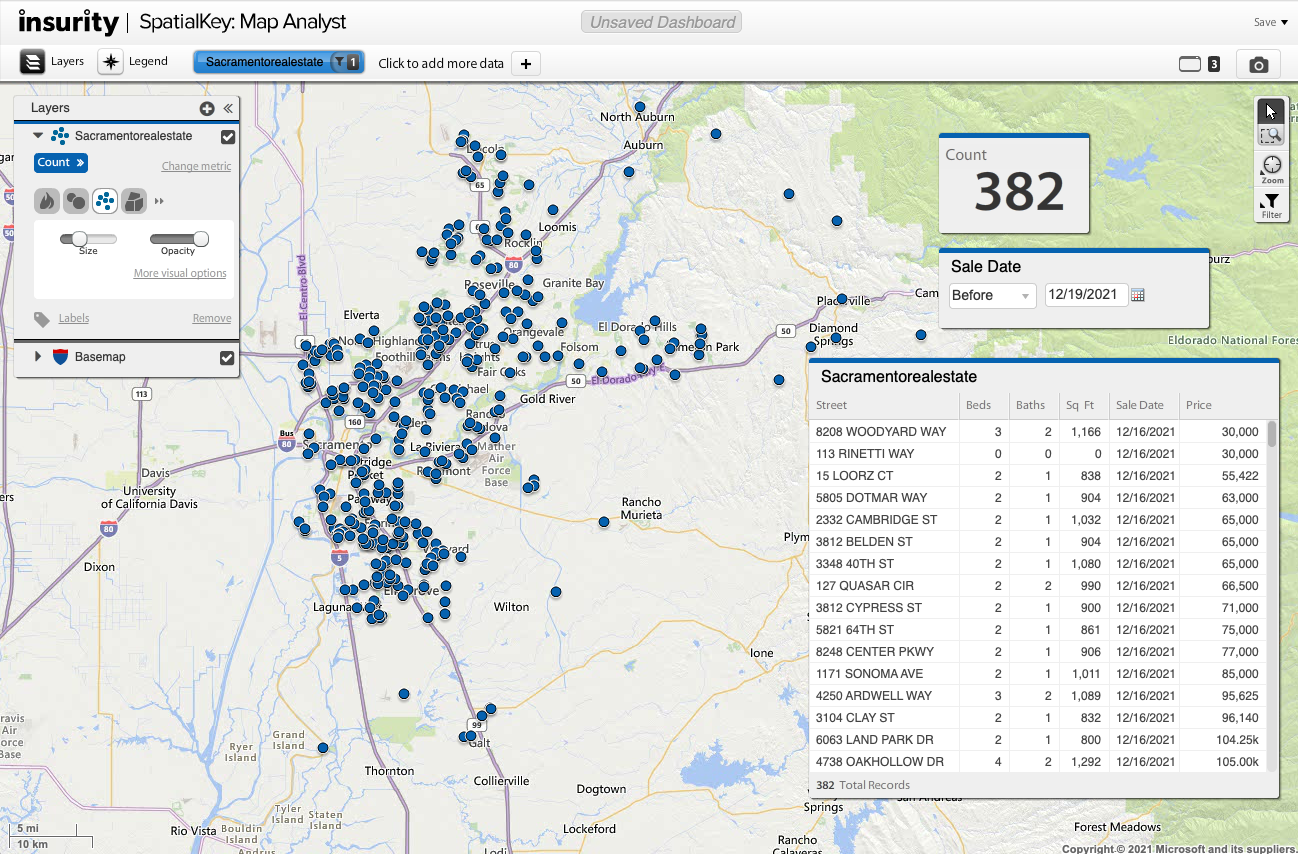
The added fields can now be used to visualize your data in your dashboard.
Use Case 2
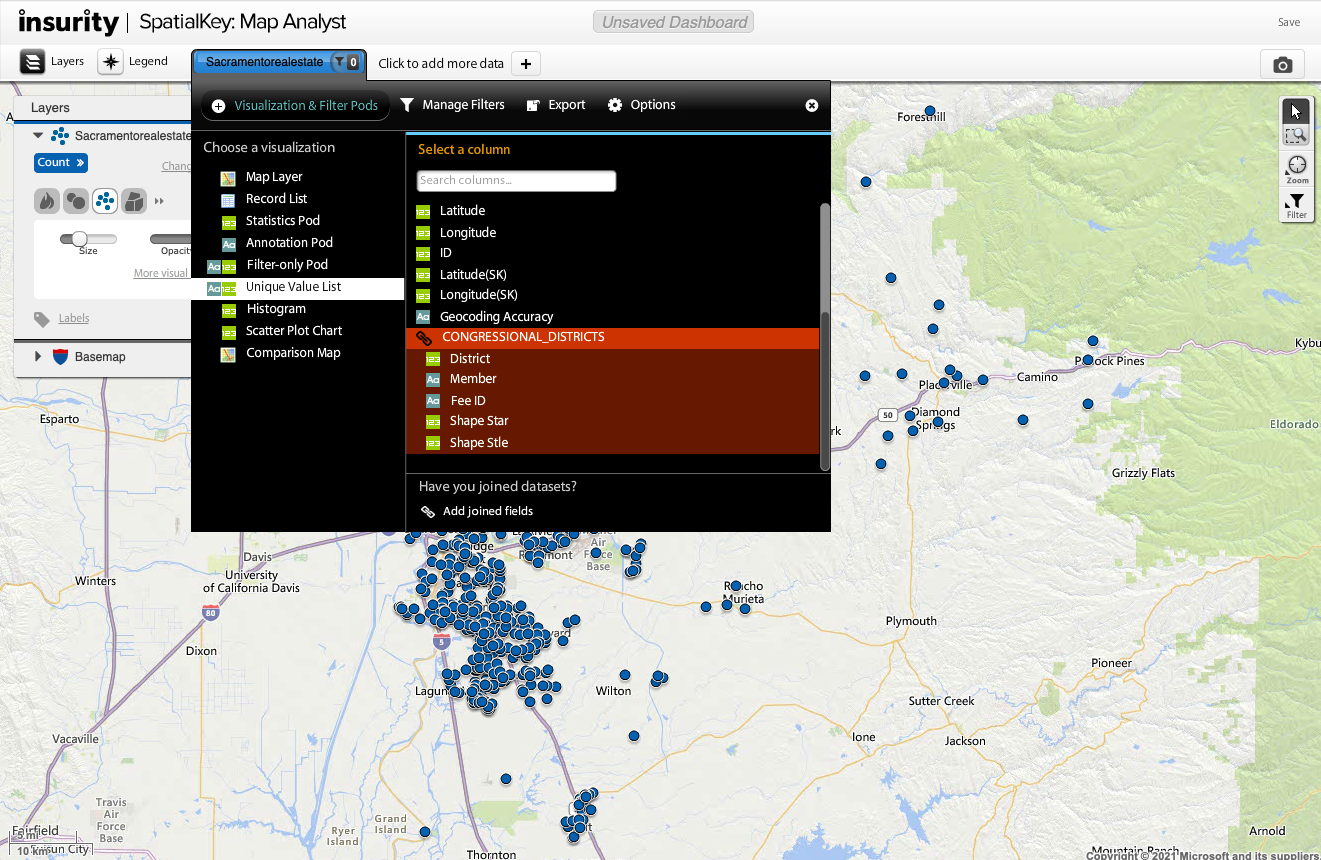
Now I want to take that same point dataset and see which congressional district each location falls in. I have a shapefile that represents my congressional districts and I want to enhance my point dataset with this information.
First, I need to join my point dataset to my shapefile. To set up this join, go to the Manage Data settings for the point dataset or setup the join from within the dashboard. For more detail, check out this article on Dataset Joins.
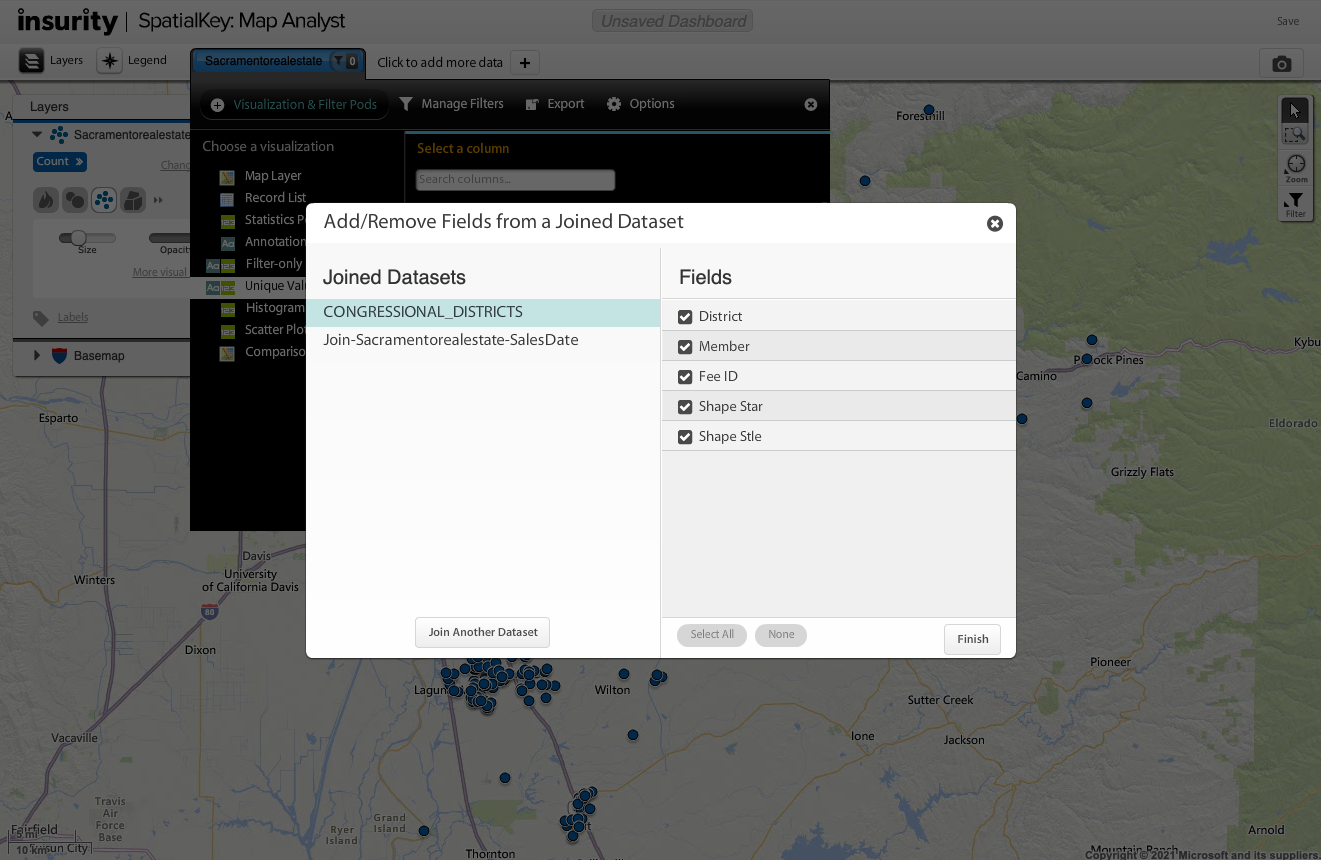
Now that the join has been set up, I can leverage the joined fields in my dashboard. Expand the Dataset Configuration Panel, select your visualization and “add joined fields”.
Select which fields from the joined datasets you want to use in your dashboard.
The added fields can now be used to visualize your data in your dashboard.