
You can quickly filter your data geographically by adding shapes to your map. You can add simple circles and rectangles as well as more complex polygons. When you add these shapes you can turn data filtering on to see your data filtered within the shapes.
Custom shape tools included in SpatialKey:
Adding Shapes
To start using shapes click the Drawing Tool icon in the Toolbar Manager to open your custom shape filters.
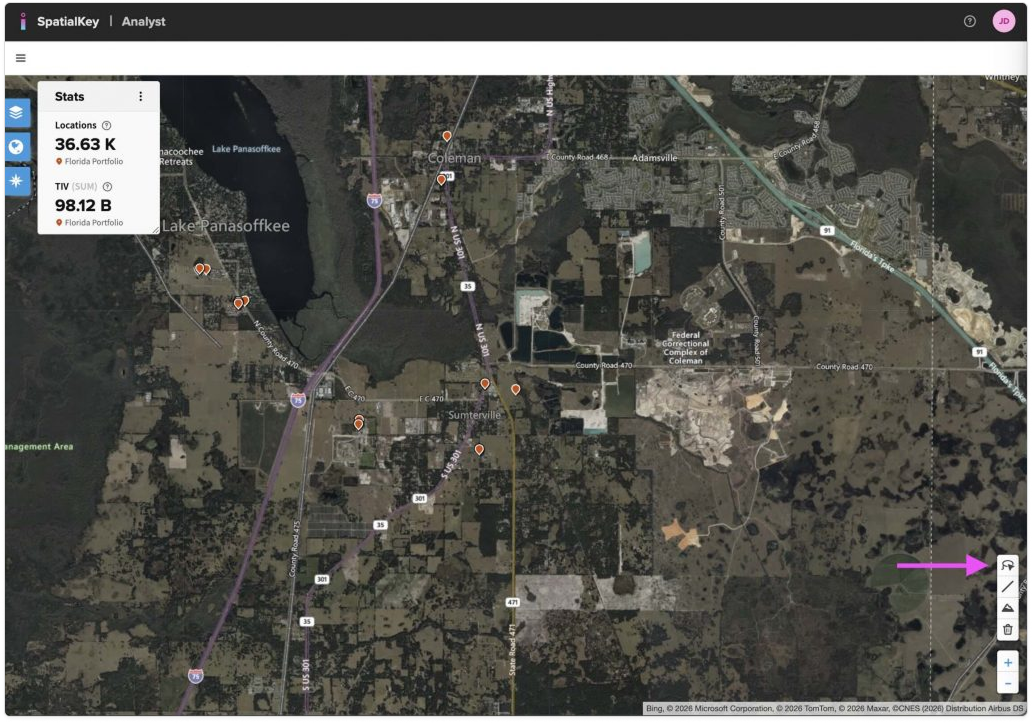
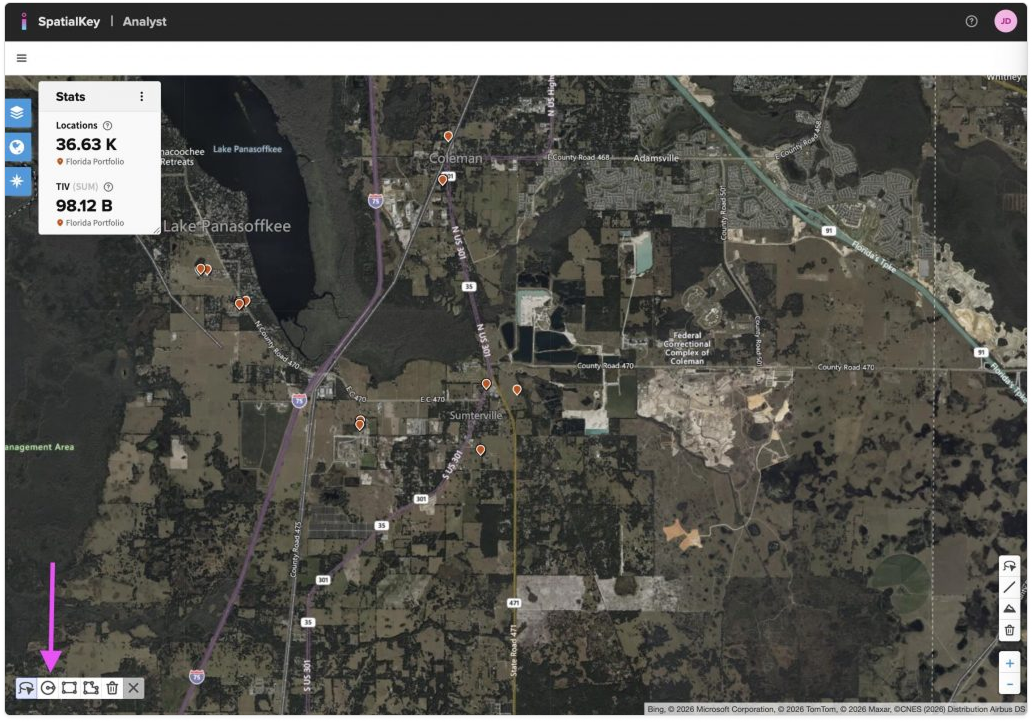
Select to add either a Freehand, Circle, Rectangle, or Polygon shape. All shapes will provide either the radius, perimeter or square ft/mi depending on what’s relevant for the shape. This can be very useful for measuring rooftops or understanding what falls within a specified radius, for example.
If you’re trying to do some quick filtering around a certain area then adding a circle or rectangle might be all you need. If you’re trying to outline a very specific area on the map then you should add a polygon or use the freehand tool.
Once you add the custom shape layer it will appear on the map in edit mode. While the shape is in edit mode, you can customize its size and position before applying it to the map. Move shapes around the map by dragging them. Resize using the white handles at the edge of the shape.
Use the trash can to remove all drawn shapes or select a specific shape and hit delete on your keyboard to remove a shape.
Freehand Tool
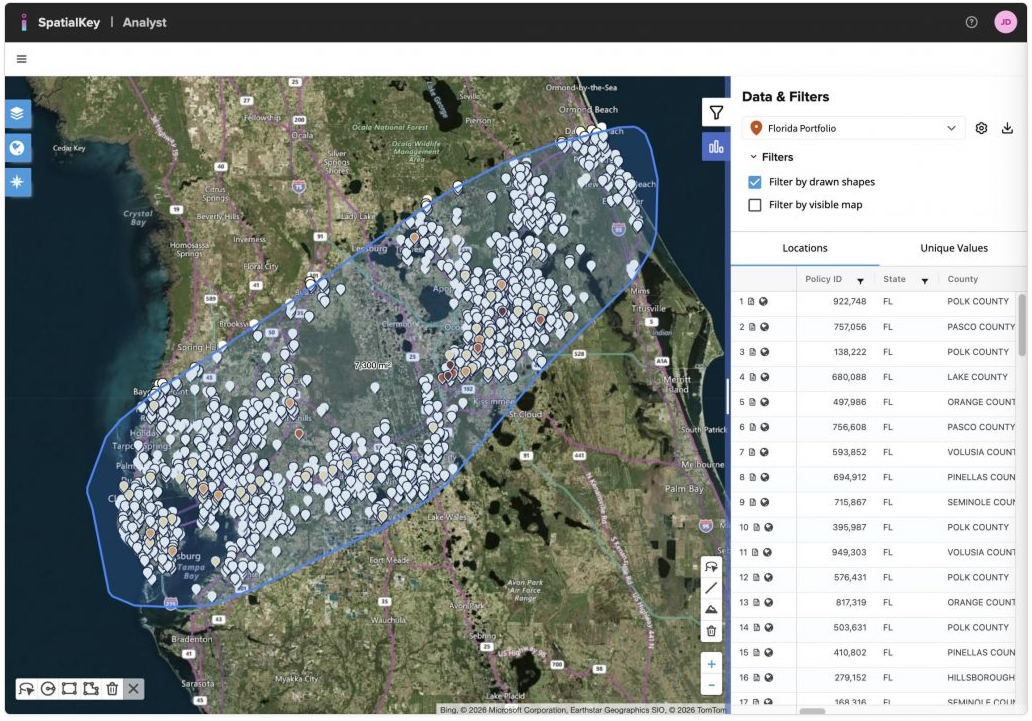
With the Freehand tool, you can draw a shape as if you’re using a pencil. Press, hold, and drag to draw your shape, then release to finish—your shape will appear automatically. This tool is ideal for rough filters or complex, rounded shapes. The example below shows a freehand shape used to approximate a storm path.
Click the shape and the Edit Shape panel will appear. Freehand editing options include:
- Move the shape
- Resize by dragging the white handles (or vertices)
- Adjust line thickness
- Change the color
The Filter by drawn shapes checkbox in the List Report is selected by default. You can turn it off if you want to keep the shape visible without filtering the data.
Circle Tool
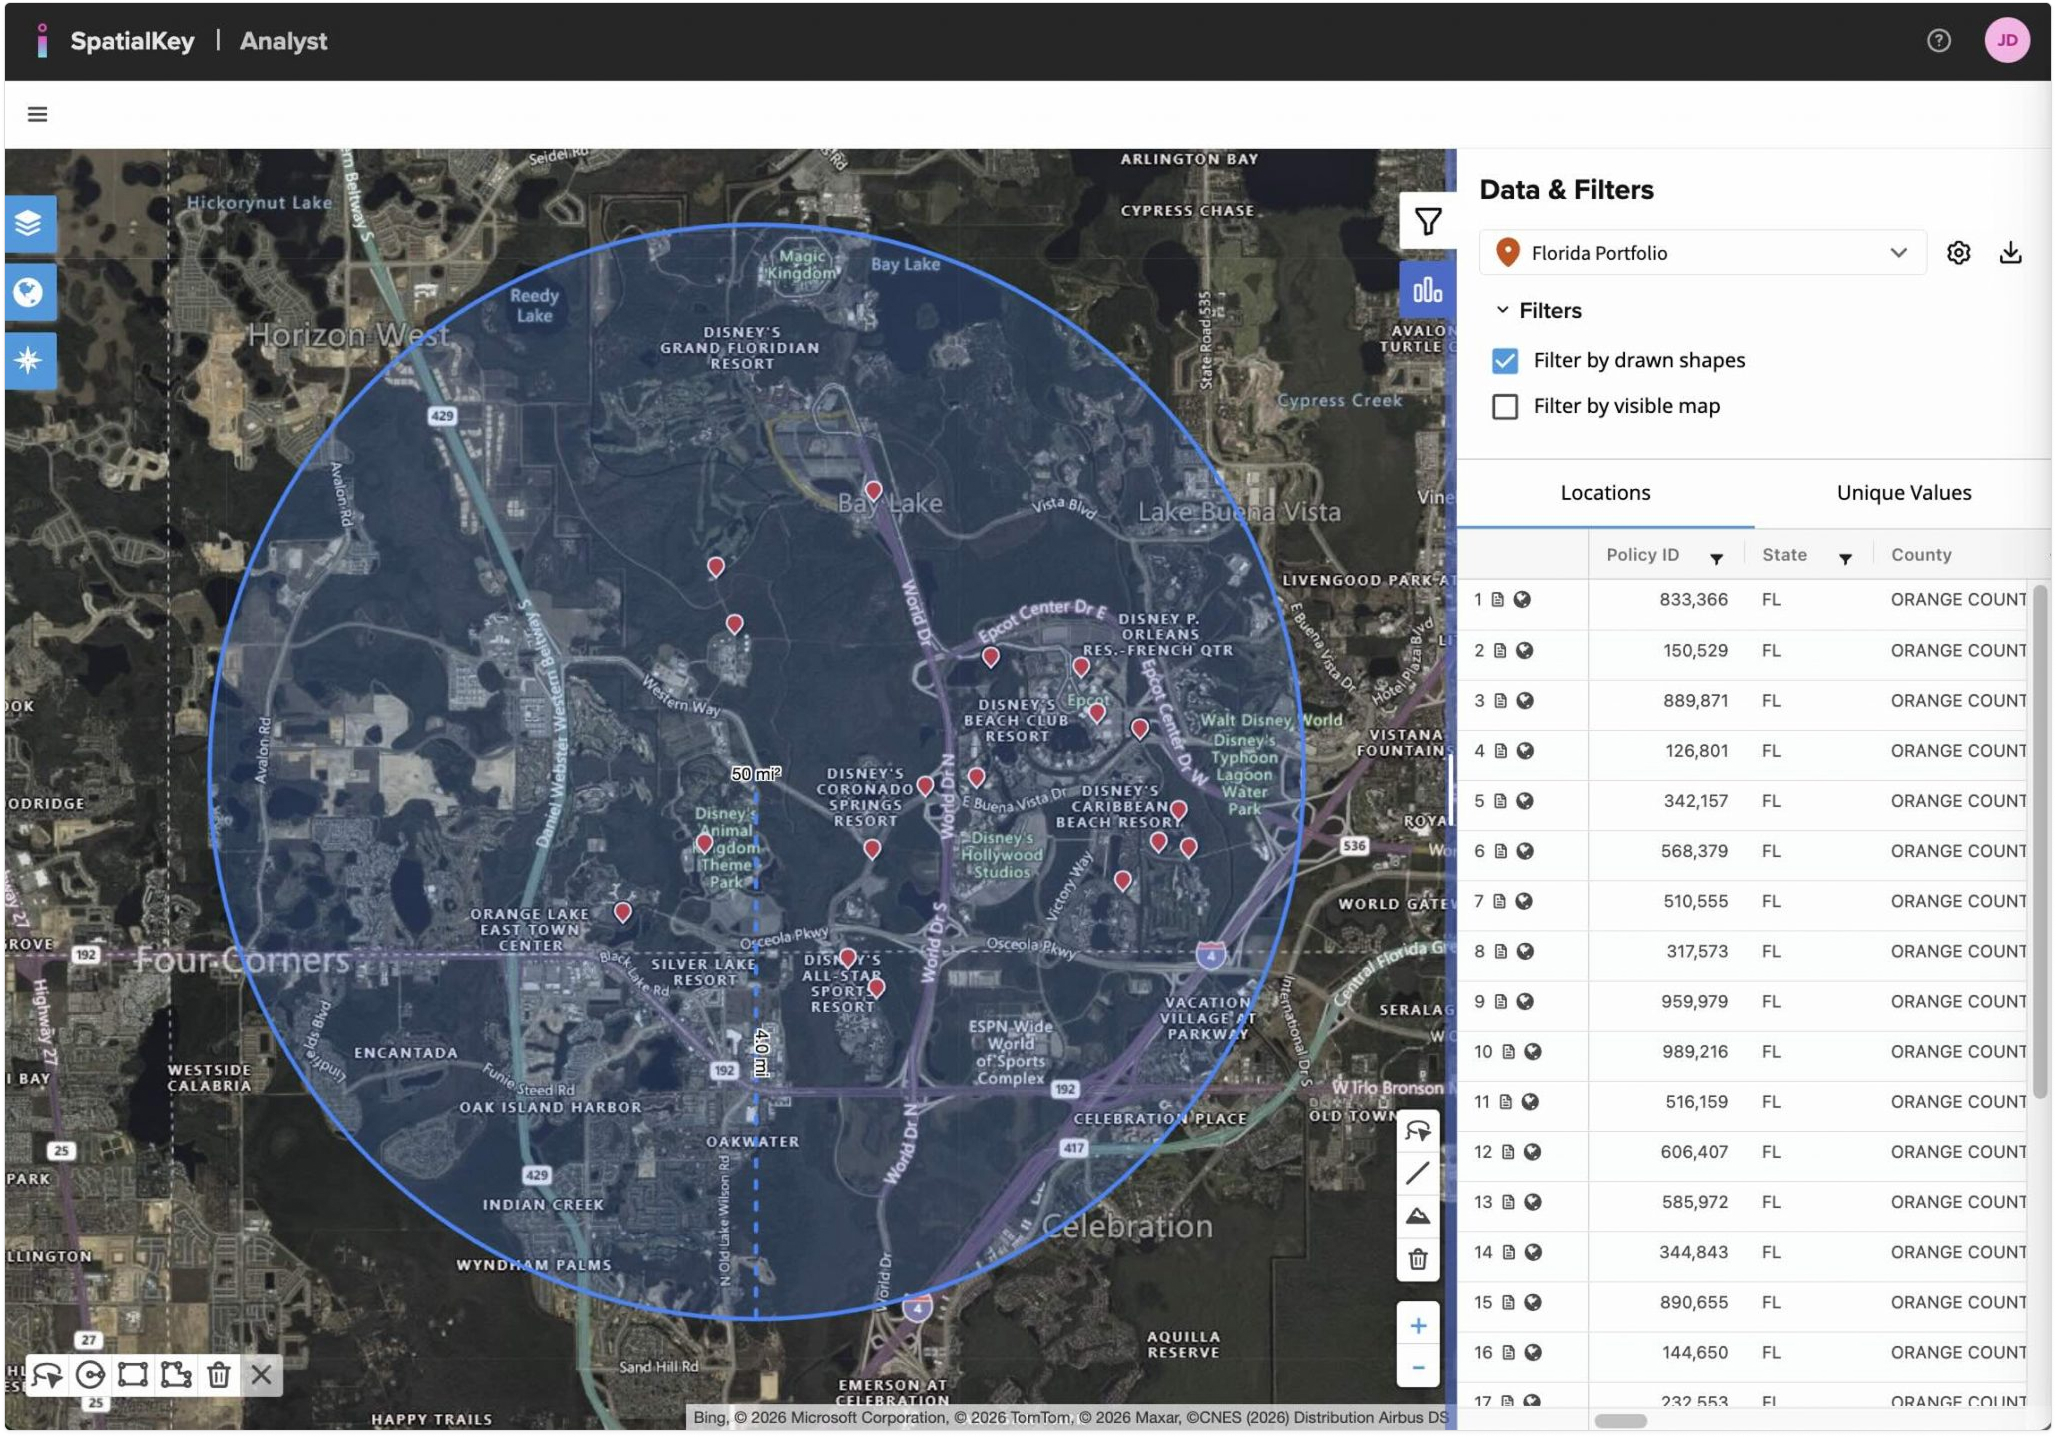
With the Circle tool, you draw a circle from the center point outward. Press, hold, and drag to set the radius, then release to finish—the circle appears automatically. This tool is ideal for measuring accumulations within a specific radius or filtering around an address or latitude/longitude. See this article to learn more about centering on a specific address. The example below shows a radius highlighting an exposure accumulation
Click the shape and the Edit Shape panel will appear. Circle editing options include:
- Move the shape
- Resize by dragging the white handle on the outside edge
- Set Radius (by specified feet or miles)
- Center on Address (or Lat/Long)
- Adjust line thickness
- Change the color
The Filter by drawn shapes checkbox in the List Report is selected by default. You can turn it off if you want to keep the shape visible without filtering the data.
Rectangle Tool
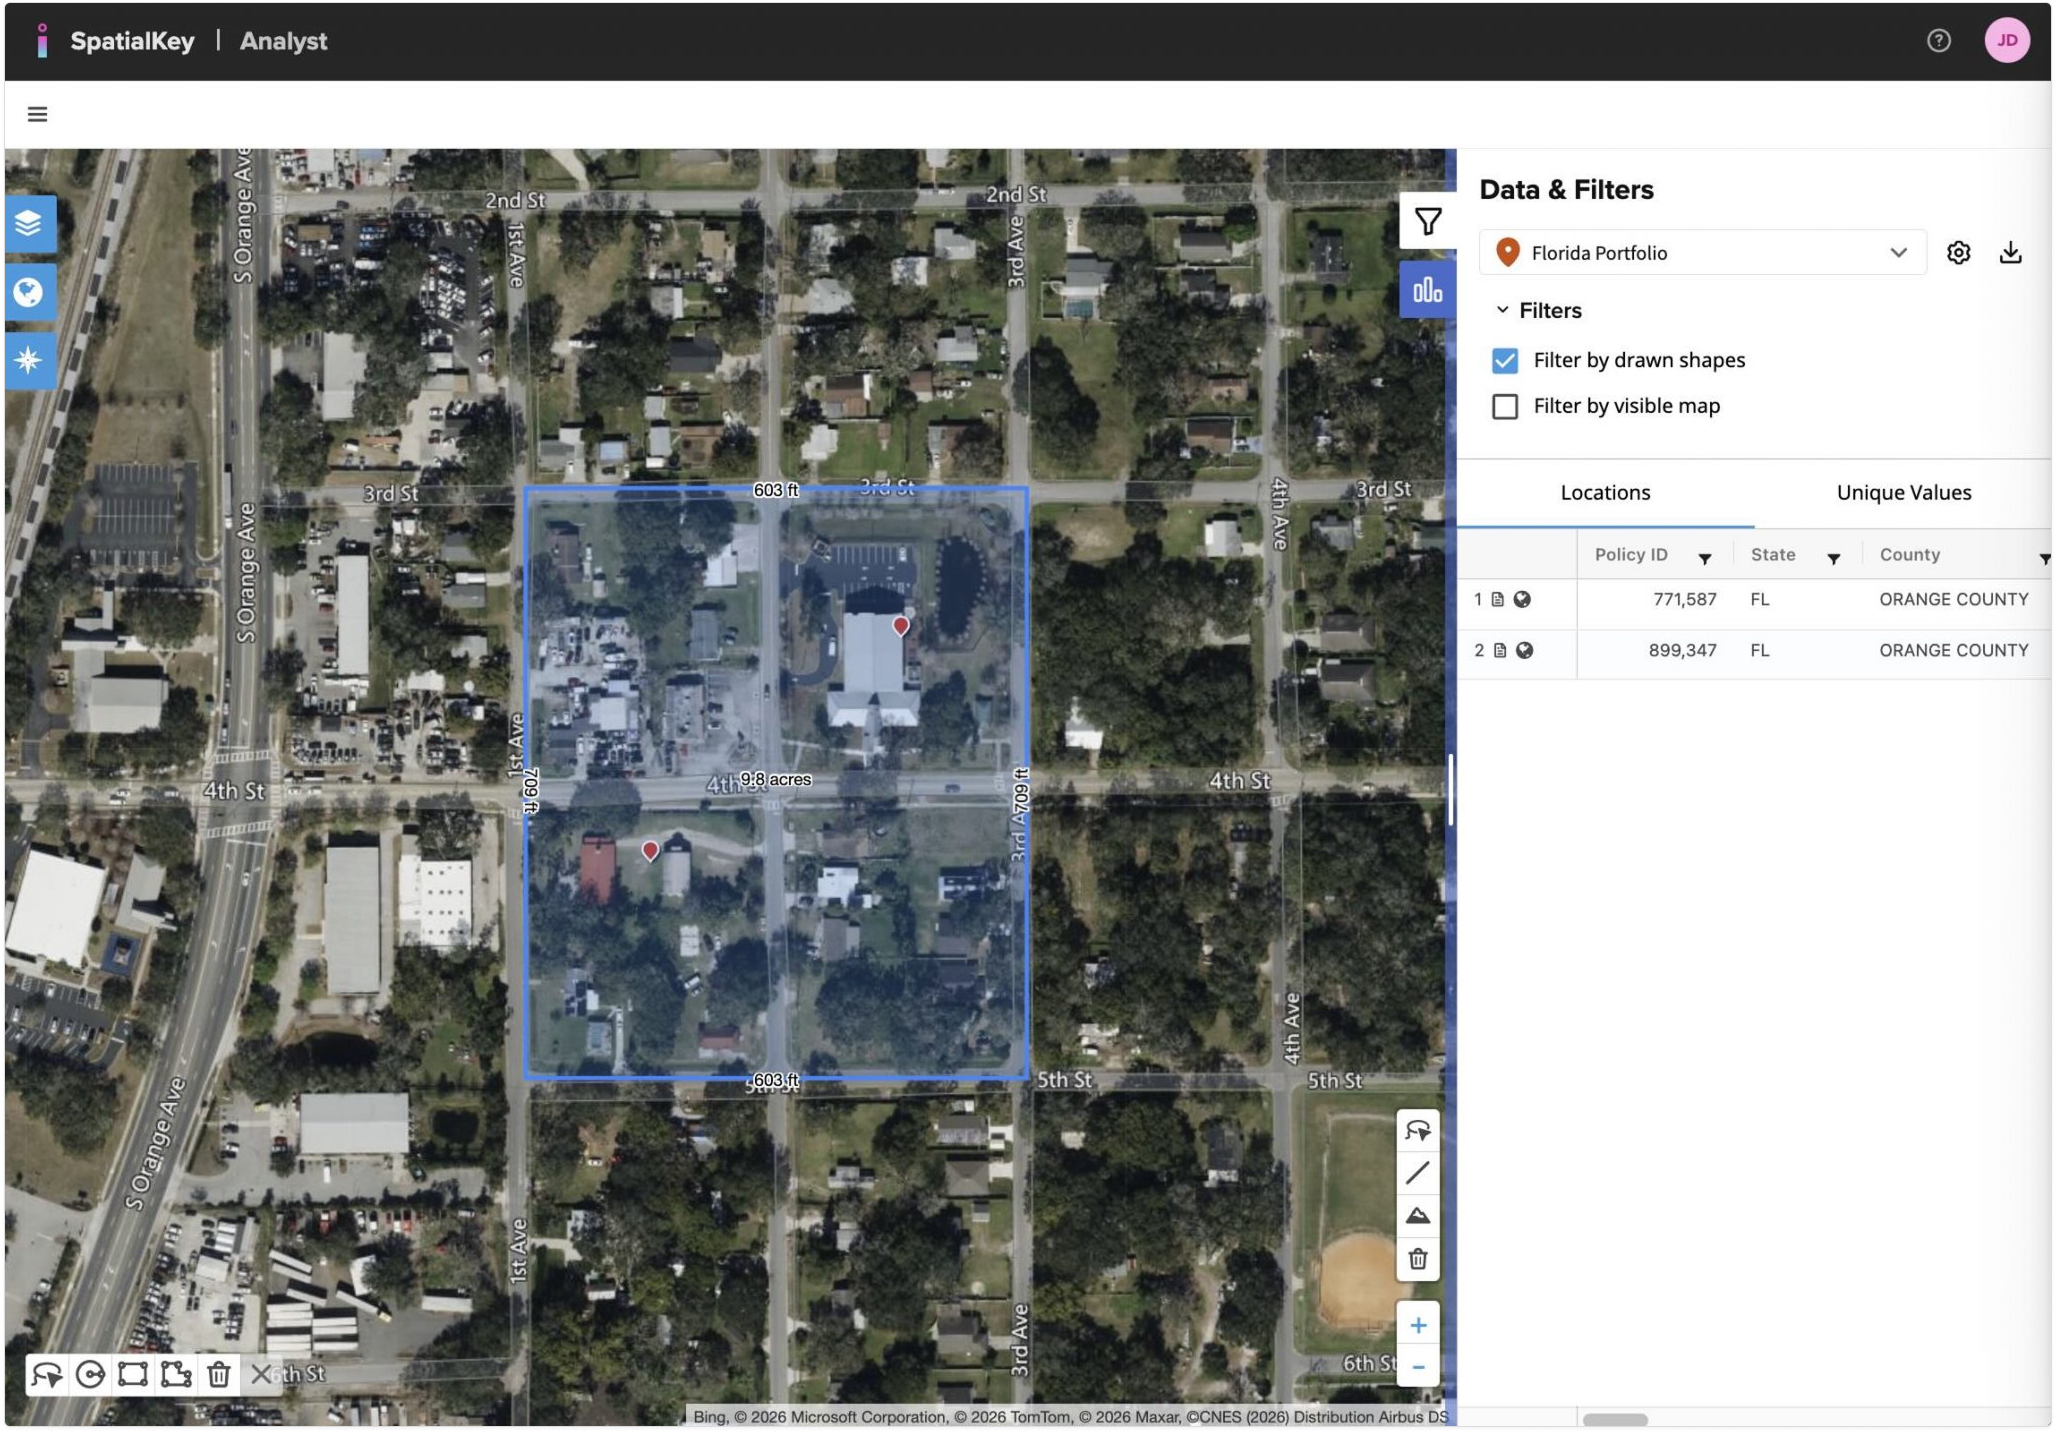
With the Rectangle tool, you draw a square or rectangle from one corner point outward. Press, hold, and drag to set the length and width, then release to finish—the rectangle appears automatically. This tool is ideal for measuring rooftops or rough filtering around locations or gridded areas like a city block. The example below shows a rectangle around a 4-block area.
Click the shape and the Edit Shape panel will appear. Rectangle editing options include:
- Move the shape
- Resize it by dragging individual vertices
- Adjust line thickness
- Change the color
The Filter by drawn shapes checkbox in the List Report is selected by default. You can turn it off if you want to keep the shape visible without filtering the data.
Polygon Tool
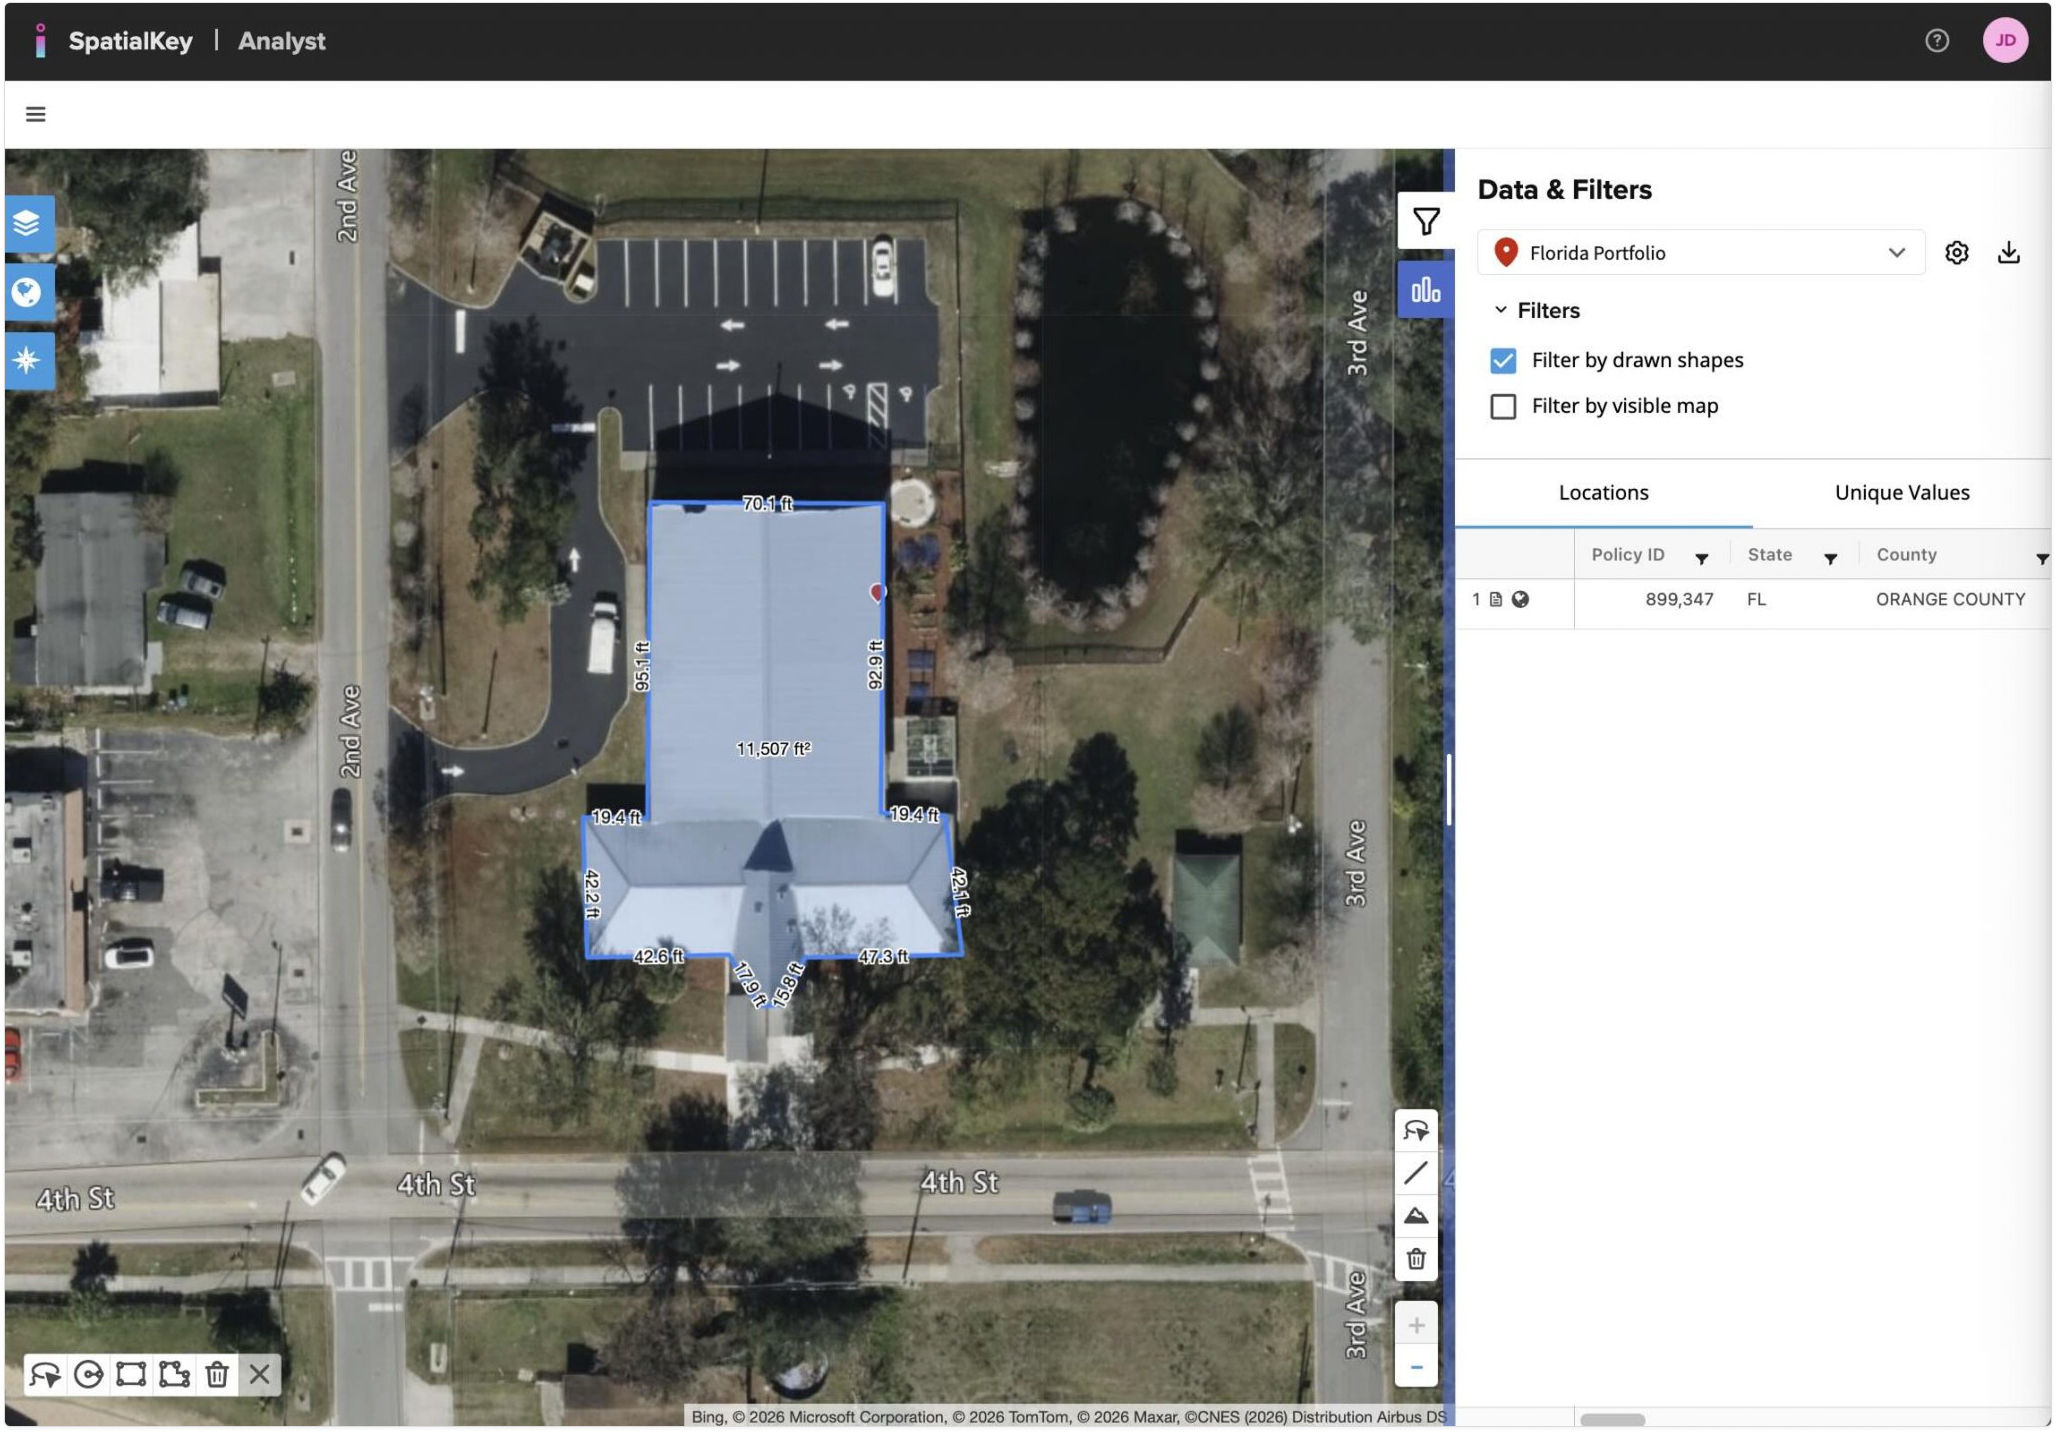
With the Polygon tool, click to place each vertex of the shape. Double-click or click the last point to finish—the polygon appears as you draw. This tool is ideal for outlining irregular shapes, such as rooftops, or defining custom zones. The example below shows a polygon drawn around a rooftop.
Click the shape and the Edit Shape panel will appear. Polygon editing options include:
- Move the shape
- Resize it by dragging individual vertices
- Adjust line thickness
- Change the color
The Filter by drawn shapes checkbox in the List Report is selected by default. You can turn it off if you want to keep the shape visible without filtering the data.

Was this helpful?